Berkshire Hathaway 2002 Annual Report Download - page 25
Download and view the complete annual report
Please find page 25 of the 2002 Berkshire Hathaway annual report below. You can navigate through the pages in the report by either clicking on the pages listed below, or by using the keyword search tool below to find specific information within the annual report.-
 1
1 -
2
-
3
-
4
-
5
-
6
-
7
-
8
-
9
-
10
-
11
-
12
-
13
-
14
-
 15
15 -
 16
16 -
 17
17 -
 18
18 -
 19
19 -
 20
20 -
 21
21 -
 22
22 -
 23
23 -
 24
24 -
 25
25 -
 26
26 -
 27
27 -
 28
28 -
 29
29 -
 30
30 -
 31
31 -
 32
32 -
 33
33 -
 34
34 -
 35
35 -
36
-
37
-
38
-
39
-
40
-
41
-
42
-
43
-
44
-
45
-
46
-
47
-
48
-
49
-
50
-
51
-
52
-
53
-
54
-
55
-
56
-
57
-
58
-
59
-
60
-
61
-
62
-
63
-
64
-
65
-
66
-
67
-
68
-
69
-
70
-
71
-
72
-
73
-
74
-
75
-
76
-
77
-
78
 |
 |

24
BERKSHIRE HATHAWAY INC.
and Subsidiaries
Selected Financial Data for the Past Five Years
(dollars in millions except per share data)
2002 2001 2000 1999 1998
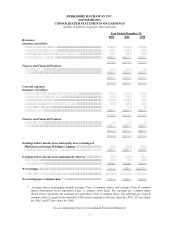
Revenues:
Insurance premiums earned .......................................... $19,182 $17,905 $19,343 $14,306 $ 5,481
Sales and service revenues............................................ 17,347 14,902 7,361 5,918 4,675
Interest, dividend and other investment income ........... 3,061 2,815 2,725 2,314 1,049
Revenues of finance and financial products
businesses .................................................................. 2,126 1,658 1,505 987 394
Realized investment gains (1) ........................................ 637 1,363 3,955 1,365 2,415
Total revenues............................................................... $42,353 $38,643 $34,889 $24,890 $14,014
Earnings:
Net earnings (1) (3) (4)....................................................... $ 4,286 $ 795 $ 3,328 $ 1,557 $ 2,830
Net earnings per share (4) .............................................. $ 2,795 $ 521 $ 2,185 $ 1,025 $ 2,262
Year-end data: (2)
Total assets ................................................................... $169,544 $162,752 $135,792 $131,416 $122,237
Notes payable and other borrowings
of non-finance businesses .......................................... 4,807 3,485 2,663 2,465 2,385
Notes payable and other borrowings of
finance businesses ..................................................... 4,481 9,019 2,116 1,998 1,503
Shareholders’ equity ..................................................... 64,037 57,950 61,724 57,761 57,403
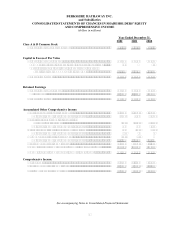
Class A equivalent common shares
outstanding, in thousands........................................... 1,535 1,528 1,526 1,521 1,519
Shareholders’ equity per outstanding
Class A equivalent common share............................. $ 41,727 $ 37,920 $ 40,442 $ 37,987 $ 37,801
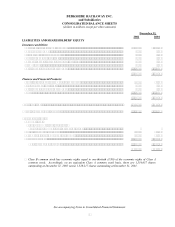
(1) The amount of realized investment gains and losses for any given period has no predictive value, and variations in amount
from period to period have no practical analytical value, particularly in view of the unrealized appreciation now existing in
Berkshire's consolidated investment portfolio. After-tax realized investment gains were $383 million in 2002, $842 million
in 2001, $2,392 million in 2000, $886 million in 1999, and $1,553 million in 1998.
(2) Year-end data for 1998 includes General Re Corporation acquired by Berkshire on December 21, 1998.
(3) Net earnings for the year ending December 31, 2001 includes pre-tax underwriting losses of $2.4 billion in connection with
the September 11th terrorist attack. Such loss reduced net earnings by approximately $1.5 billion and earnings per share by
$982.
(4) Effective January 1, 2002, Berkshire adopted Statement of Financial Accounting Standards (“SFAS”) No. 142 “Goodwill
and Other Intangible Assets.” SFAS No. 142 changed the accounting for goodwill from a model that required amortization
of goodwill, supplemented by impairment tests, to an accounting model that is based solely upon impairment tests.
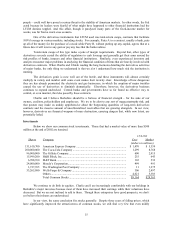
A reconciliation of Berkshire’s Consolidated Statements of Earnings for each of the five years ending December 31, 2002 from
amounts reported to amounts exclusive of goodwill amortization is shown below. Goodwill amortization for the years ending
December 31, 2001 and 2000 includes $78 million and $65 million, respectively, related to Berkshire’s equity method investment
in MidAmerican Energy Holdings Company.
2002 2001 2000 1999 1998
Net earnings as reported........................................................... $4,286 $ 795 $ 3,328 $ 1,557 $ 2,830
Goodwill amortization, after tax ............................................... — 636 548 476 111
Net earnings as adjusted ........................................................... $4,286 $ 1,431 $ 3,876 $ 2,033 $ 2,941
Earnings per Class A equivalent common share:
As reported................................................................................ $2,795 $ 521 $ 2,185 $ 1,025 $ 2,262
Goodwill amortization............................................................... — 416 360 313 88
Earnings per share as adjusted................................................. $2,795 $ 937 $ 2,545 $ 1,338 $ 2,350