Berkshire Hathaway 2002 Annual Report Download - page 51
Download and view the complete annual report
Please find page 51 of the 2002 Berkshire Hathaway annual report below. You can navigate through the pages in the report by either clicking on the pages listed below, or by using the keyword search tool below to find specific information within the annual report.-
 1
1 -
2
-
3
-
4
-
5
-
6
-
7
-
8
-
9
-
10
-
11
-
12
-
13
-
14
-
15
-
16
-
17
-
18
-
19
-
20
-
21
-
22
-
23
-
24
-
25
-
26
-
27
-
28
-
29
-
30
-
31
-
32
-
33
-
34
-
35
-
36
-
37
-
38
-
39
-
40
-
 41
41 -
 42
42 -
 43
43 -
 44
44 -
 45
45 -
 46
46 -
 47
47 -
 48
48 -
 49
49 -
 50
50 -
 51
51 -
 52
52 -
 53
53 -
 54
54 -
 55
55 -
 56
56 -
 57
57 -
 58
58 -
 59
59 -
 60
60 -
 61
61 -
62
-
63
-
64
-
65
-
66
-
67
-
68
-
69
-
70
-
71
-
72
-
73
-
74
-
75
-
76
-
77
-
78
 |
 |

50
Notes to Consolidated Financial Statements (Continued)
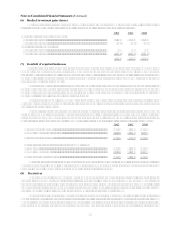
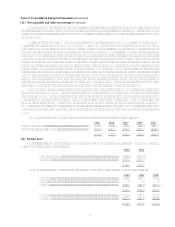
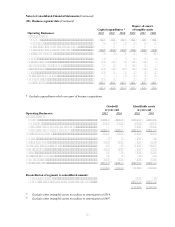
(18) Business segment data (Continued)
Deprec. & amort.
Capital expenditures * of tangible assets
Operating Businesses: 2002 2001 2000 2002 2001 2000
Insurance group:
GEICO ........................................................................... $ 31 $ 20 $ 29 $ 32 $ 70 $ 64
General Re...................................................................... 18 19 22 17 20 39
Berkshire Hathaway Reinsurance Group .......................
Berkshire Hathaway Primary Group .............................. 4 3 4 3 2 1
Total insurance group........................................................ 53 42 55 52 92 104
Apparel.............................................................................. 51 8 6 32 13 12
Building products.............................................................. 158 152 15 157 124 9
Finance and financial products.......................................... 48 16 1 143 50 3
Flight services ................................................................... 241 408 472 127 108 90
Retail................................................................................. 113 76 48 40 37 33
Scott Fetzer Companies .................................................... 7 6 11 10 10 10
Shaw Industries................................................................. 196 71 91 88
Other businesses................................................................ 61 32 22 27 22 21
$ 928 $ 811 $ 630 $ 679 $ 544 $ 282
* Excludes expenditures which were part of business acquisitions.
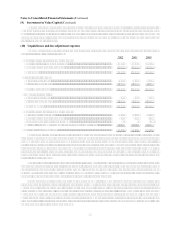
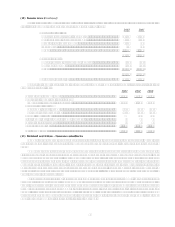
Goodwill Identifiable assets
at year-end at year-end
Operating Businesses: 2002 2001 2002 2001
Insurance group:
GEICO................................................................................... $ 1,370 $ 1,370 $ 12,751 $ 11,309
General Re............................................................................. 13,503 13,502 38,726 34,575
Berkshire Hathaway Reinsurance Group............................... 40,913 38,603
Berkshire Hathaway Primary Group ..................................... 142 119 4,770 3,360
Total insurance group............................................................... 15,015 14,991 97,160 87,847
Apparel..................................................................................... 57(1) 57 1,539 419
Building products ..................................................................... 2,082 1,992 2,515 2,535
Finance and financial products................................................. 256 256 33,578 41,591
Flight services .......................................................................... 1,369 1,369 3,105 2,816
Retail ........................................................................................ 434 434 1,341 1,215
Scott Fetzer Companies............................................................ 12 12 415 281
Shaw Industries ........................................................................ 1,941 1,686 1,932 1,619
Other businesses....................................................................... 1,132(2) 713 4,415 1,884
$22,298 $21,510 146,000 140,207
Reconciliation of segments to consolidated amount:
Corporate and other .............................................................. 1,205 992
Goodwill and other purchase-accounting adjustments ......... 22,339 21,553
$169,544 $162,752
(1) Excludes other intangible assets not subject to amortization of $314.
(2) Excludes other intangible assets not subject to amortization of $697.