Berkshire Hathaway 2002 Annual Report Download - page 42
Download and view the complete annual report
Please find page 42 of the 2002 Berkshire Hathaway annual report below. You can navigate through the pages in the report by either clicking on the pages listed below, or by using the keyword search tool below to find specific information within the annual report.-
 1
1 -
2
-
3
-
4
-
5
-
6
-
7
-
8
-
9
-
10
-
11
-
12
-
13
-
14
-
15
-
16
-
17
-
18
-
19
-
20
-
21
-
22
-
23
-
24
-
25
-
26
-
27
-
28
-
29
-
30
-
31
-
 32
32 -
 33
33 -
 34
34 -
 35
35 -
 36
36 -
 37
37 -
 38
38 -
 39
39 -
 40
40 -
 41
41 -
 42
42 -
 43
43 -
 44
44 -
 45
45 -
 46
46 -
 47
47 -
 48
48 -
 49
49 -
 50
50 -
 51
51 -
 52
52 -
53
-
54
-
55
-
56
-
57
-
58
-
59
-
60
-
61
-
62
-
63
-
64
-
65
-
66
-
67
-
68
-
69
-
70
-
71
-
72
-
73
-
74
-
75
-
76
-
77
-
78
 |
 |

41
(8) Derivatives (Continued)
liquidity over a one week period. GRS has established $15 million as its value at risk limit with a 99th percentile
confidence interval for potential losses over a weekly horizon.
GRS evaluates and records a fair value adjustment against trading revenue to recognize counterparty credit
exposure and future costs associated with administering each contract. The fair value adjustment for counterparty credit
exposures and future administrative costs on existing contracts was $95 million at December 31, 2002. Counterparty
credit limits are established, and credit exposures are monitored in accordance with these limits. GRS receives cash and/or
investment grade securities from certain counterparties as collateral and, where appropriate, may purchase credit
insurance or enter into other transactions to mitigate its credit exposure. GRS also incorporates into contracts with certain
counterparties provisions which allow the unwinding of these transactions in the event of a downgrade in credit rating or
other indications of decline in creditworthiness of the counterparty.
At December 31, 2002, GRS had accepted collateral that is permitted by contract or industry practice to sell or
repledge with a fair value of $1,884 million. Of the securities held as collateral, approximately $83 million were
repledged as of December 31, 2002. At December 31, 2002, securities owned by GRS with a fair value of approximately
$421 million (which includes $83 million of repledged securities as described above) were pledged against derivative
transactions with a fair value of $753 million. Further, securities with a fair value of approximately $75 million were
pledged against futures positions at two futures clearing brokers. Contractual terms with counterparties often require
additional collateral to be posted immediately in the event of a decline in the financial rating of the counterparty or its
guarantor.
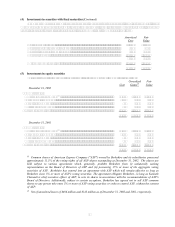
Assuming non-performance by all counterparties on all contracts potentially subject to a loss, the maximum
potential loss, based on the cost of replacement, net of collateral held, at market rates prevailing at December 31, 2002
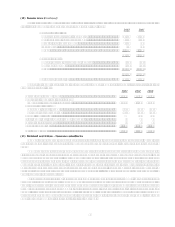
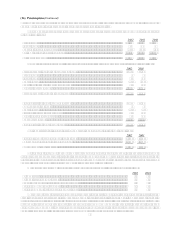
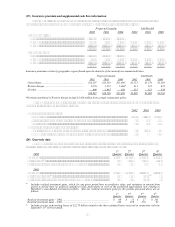
approximated $4,933 million. The following table presents GRSs derivatives portfolio by counterparty credit quality and
maturity at December 31, 2002. The amounts shown under gross exposure in the table are before consideration of netting
arrangements and collateral held by GRS. Net fair value shown in the table represents unrealized gains on financial
instrument contracts in gain positions, net of any unrealized loss owed to these counterparties on offsetting positions. Net
exposure shown in the table that follows is net fair value less collateral held by GRS. Amounts are in millions.
Gross Exposure
Net Fair Net Percentage
0 5 6 10 Over 10 Total Value Exposure of Total
Credit quality (years)
AAA ....................................... $1,201 $1,026 $1,072 $ 3,299 $ 917 $ 917 19%
AA.......................................... 3,749 3,514 3,734 10,997 3,124 2,437 49
A............................................. 3,649 2,999 3,787 10,435 2,106 1,303 26
BBB and Below...................... 489 364 105 958 435 276 6
Total $9,088 $7,903 $8,698 $25,689 $6,582 $4,933 100%
Liquidity risk can arise from funding of GRSs portfolio of open transactions. Movements in underlying market
variables affect both future cash flows related to the transactions and collateral required to cover the value of open
positions. Strategies have been developed to ensure GRS has sufficient resources to cover its potential liquidity needs
through its access to General Re Corporations (the parent company of GRS) internal sources of liquidity, commercial
paper program, lines of credit and medium-term program.
(9) Investment in Value Capital
On July 1, 1998, Value Capital L.P., (Value Capital) a limited partnership commenced operations. A wholly
owned Berkshire subsidiary is a limited partner in Value Capital. The partnerships objective is to achieve income and
capital growth from investments and arbitrage in fixed income investments. Berkshire currently accounts for this
investment pursuant to the equity method. Since inception Berkshire has contributed $430 million to the partnership and
other partners, including the general partner, have contributed $20 million. Profits and losses of the partnership are
allocated to the partners based upon each partners investment. At December 31, 2002, the carrying value of $603
million (including Berkshires share of accumulated earnings of $173 million) is included as a component of other assets
of finance and financial products businesses. Berkshire possesses no management authority over the activities
conducted by Value Capital and it does not provide any financial support of the obligations of this partnership or of the
other partners. As a limited partner, Berkshires exposure to loss is limited to the carrying value of its investment.