Berkshire Hathaway 2002 Annual Report Download - page 29
Download and view the complete annual report
Please find page 29 of the 2002 Berkshire Hathaway annual report below. You can navigate through the pages in the report by either clicking on the pages listed below, or by using the keyword search tool below to find specific information within the annual report.-
 1
1 -
2
-
3
-
4
-
5
-
6
-
7
-
8
-
9
-
10
-
11
-
12
-
13
-
14
-
15
-
16
-
17
-
18
-
 19
19 -
 20
20 -
 21
21 -
 22
22 -
 23
23 -
 24
24 -
 25
25 -
 26
26 -
 27
27 -
 28
28 -
 29
29 -
 30
30 -
 31
31 -
 32
32 -
 33
33 -
 34
34 -
 35
35 -
 36
36 -
 37
37 -
 38
38 -
 39
39 -
40
-
41
-
42
-
43
-
44
-
45
-
46
-
47
-
48
-
49
-
50
-
51
-
52
-
53
-
54
-
55
-
56
-
57
-
58
-
59
-
60
-
61
-
62
-
63
-
64
-
65
-
66
-
67
-
68
-
69
-
70
-
71
-
72
-
73
-
74
-
75
-
76
-
77
-
78
 |
 |

28
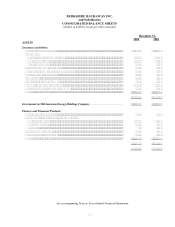
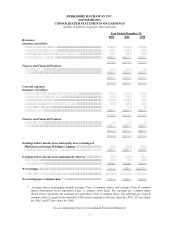
BERKSHIRE HATHAWAY INC.
and Subsidiaries
CONSOLIDATED STATEMENTS OF EARNINGS
(dollars in millions except per share amounts)
Year Ended December 31,
2002 2001 2000
Revenues:
Insurance and Other:
Insurance premiums earned.............................................................. $19,182 $17,905 $19,343
Sales and service revenues ............................................................... 17,347 14,902 7,361
Interest, dividend and other investment income ............................... 3,061 2,815 2,725
Realized investment gains ................................................................ 637 1,363 3,955
40,227 36,985 33,384
Finance and Financial Products:
Interest income ................................................................................. 1,497 1,377 910
Other................................................................................................. 629 281 595
2,126 1,658 1,505
42,353 38,643 34,889
Cost and expenses:
Insurance and Other:
Insurance losses and loss adjustment expenses ................................ 15,269 18,398 17,332
Insurance underwriting expenses...................................................... 4,324 3,574 3,632
Cost of sales and services................................................................. 12,077 10,446 4,893
Selling, general and administrative expenses................................... 3,310 3,000 1,703
Goodwill amortization...................................................................... 572 715
Interest expense ................................................................................ 194 209 144
35,174 36,199 28,419
Finance and Financial Products:
Interest expense................................................................................ 531 759 772
Other................................................................................................. 530 331 177
1,061 1,090 949
36,235 37,289 29,368
Earnings before income taxes and equity in net earnings of
MidAmerican Energy Holdings Company................................... 6,118 1,354 5,521
Equity in net earnings of MidAmerican Energy Holdings Company.. 317 115 66
Earnings before income taxes and minority interest...................... 6,435 1,469 5,587
Income taxes..................................................................................... 2,134 620 2,018
Minority interest............................................................................... 15 54 241
Net earnings ....................................................................................... $ 4,286 $ 795 $ 3,328
Average common shares outstanding *............................................ 1,533,294 1,527,234 1,522,933
Net earnings per common share *.................................................... $ 2,795 $ 521 $ 2,185
* Average shares outstanding include average Class A common shares and average Class B common
shares determined on an equivalent Class A common stock basis. Net earnings per common share
shown above represents net earnings per equivalent Class A common share. Net earnings per Class B
common share is equal to one-thirtieth (1/30) of such amount or $93 per share for 2002, $17 per share
for 2001, and $73 per share for 2000.
See accompanying Notes to Consolidated Financial Statements