Berkshire Hathaway 2002 Annual Report Download - page 52
Download and view the complete annual report
Please find page 52 of the 2002 Berkshire Hathaway annual report below. You can navigate through the pages in the report by either clicking on the pages listed below, or by using the keyword search tool below to find specific information within the annual report.-
 1
1 -
2
-
3
-
4
-
5
-
6
-
7
-
8
-
9
-
10
-
11
-
12
-
13
-
14
-
15
-
16
-
17
-
18
-
19
-
20
-
21
-
22
-
23
-
24
-
25
-
26
-
27
-
28
-
29
-
30
-
31
-
32
-
33
-
34
-
35
-
36
-
37
-
38
-
39
-
40
-
41
-
 42
42 -
 43
43 -
 44
44 -
 45
45 -
 46
46 -
 47
47 -
 48
48 -
 49
49 -
 50
50 -
 51
51 -
 52
52 -
 53
53 -
 54
54 -
 55
55 -
 56
56 -
 57
57 -
 58
58 -
 59
59 -
 60
60 -
 61
61 -
 62
62 -
63
-
64
-
65
-
66
-
67
-
68
-
69
-
70
-
71
-
72
-
73
-
74
-
75
-
76
-
77
-
78
 |
 |

51
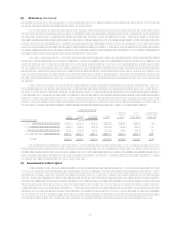
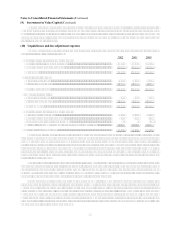
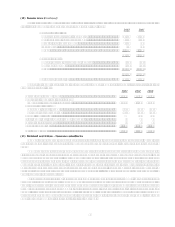
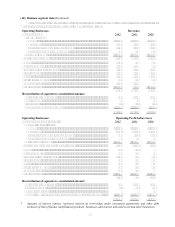
(19) Insurance premium and supplemental cash flow information
Premiums written and earned by Berkshires property/casualty and life/health insurance businesses during
each of the three years ending December 31, 2002 are summarized below. Dollars are in millions.
Property/Casualty Life/Health
2002 2001 2000 2002 2001 2000
Premiums Written:
Direct................................................................. $ 9,457 $ 8,294 $ 6,858
Assumed............................................................ 10,471 9,332 11,270 $2,031 $2,162 $2,520
Ceded ................................................................ (961) (890) (729) (132) (157) (257)
$18,967 $16,736 $17,399 $1,899 $2,005 $2,263
Premiums Earned:
Direct................................................................. $ 8,825 $ 7,654 $ 6,666
Assumed............................................................ 9,293 9,097 11,036 $2,021 $2,143 $2,513
Ceded ................................................................ (822) (834) (620) (135) (155) (252)
$17,296 $15,917 $17,082 $1,886 $1,988 $2,261
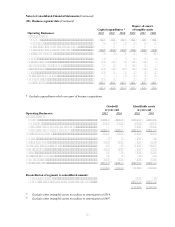
Insurance premiums written by geographic region (based upon the domicile of the insured) are summarized below.
Property/Casualty Life/Health
2002 2001 2000 2002 2001 2000
United States ................................................................ $14,297 $13,319 $11,409 $1,153 $1,176 $1,296
Western Europe............................................................ 3,870 2,352 5,064* 411 518 633
All other ....................................................................... 800 1,065 926 335 311 334
$18,967 $16,736 $17,399 $1,899 $2,005 $2,263
*Premiums attributed to Western Europe include $2,438 million from a single reinsurance policy.
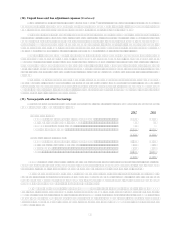
A summary of supplemental cash flow information for each of the three years ending December 31, 2002 is
presented in the following table (in millions).
2002 2001 2000
Cash paid during the year for:
Income taxes............................................................................................................... $1,945 $ 905 $1,396
Interest of finance and financial products businesses................................................. 508 722 794
Other interest.............................................................................................................. 208 225 157
Non-cash investing and financing activities:
Liabilities assumed in connection with acquisitions of businesses ............................ 700 3,507 901
Common shares issued in connection with acquisitions of businesses....................... 324 224
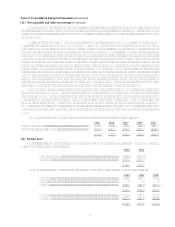
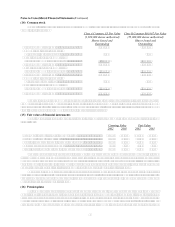
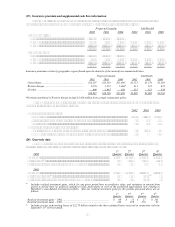
(20) Quarterly data
A summary of revenues and earnings by quarter for each of the last two years is presented in the following
table. This information is unaudited. Dollars are in millions, except per share amounts.
1
st
2
nd
3
rd
4
th
2002 Quarter Quarter Quarter Quarter
Revenues ................................................................................................. $9,521 $10,051 $10,637 $12,144
Net earnings (1)......................................................................................... 916 1,045 1,141 1,184
Net earnings per equivalent Class A common share ............................... 598 681 744 772
2001
Revenues ................................................................................................. $8,304 $10,886 $ 9,554 $ 9,899
Net earnings (loss) (1) ............................................................................... 606 773 (679)(2) 95
Net earnings (loss) per equivalent Class A common share...................... 397 506 (445) 63
(1) Includes realized investment gains, which, for any given period have no predictive value, and variations in amount from
period to period have no practical analytical value, particularly in view of the unrealized appreciation now existing in
Berkshire’s consolidated investment portfolio. After-tax realized investment gains for the periods presented above are as
follows:
1
s
t
2
nd
3
rd
4
th
Quarter Quarter Quarter Quarter
Realized investment gains
–
2002
.......................................................................
$98
$13
$27
$ 245
Realized investment gains
–
2001
.......................................................................
144
420
216
62
(2) Includes pre-tax underwriting losses of $2.275 billion related to the then estimated losses incurred in connection with the
September 11th terrorist attack.