Berkshire Hathaway 2002 Annual Report Download - page 60
Download and view the complete annual report
Please find page 60 of the 2002 Berkshire Hathaway annual report below. You can navigate through the pages in the report by either clicking on the pages listed below, or by using the keyword search tool below to find specific information within the annual report.-
 1
1 -
2
-
3
-
4
-
5
-
6
-
7
-
8
-
9
-
10
-
11
-
12
-
13
-
14
-
15
-
16
-
17
-
18
-
19
-
20
-
21
-
22
-
23
-
24
-
25
-
26
-
27
-
28
-
29
-
30
-
31
-
32
-
33
-
34
-
35
-
36
-
37
-
38
-
39
-
40
-
41
-
42
-
43
-
44
-
45
-
46
-
47
-
48
-
49
-
 50
50 -
 51
51 -
 52
52 -
 53
53 -
 54
54 -
 55
55 -
 56
56 -
 57
57 -
 58
58 -
 59
59 -
 60
60 -
 61
61 -
 62
62 -
 63
63 -
 64
64 -
 65
65 -
 66
66 -
 67
67 -
 68
68 -
 69
69 -
 70
70 -
71
-
72
-
73
-
74
-
75
-
76
-
77
-
78
 |
 |

59
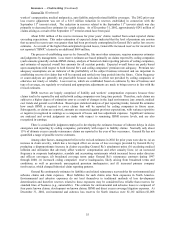
Insurance — Investment Income (Continued)
of the one quarter lag in reporting in the fourth quarter. Pre-tax investment income in 2000 included $103 million
related to the extra quarter.
Invested assets increased during 2002 by $7 billion to $79 billion at December 31, 2002 following a
decrease of $4 billion during 2001. The increase in invested assets during 2002 was primarily the result of
significant operating cash flow, represented by a $6 billion increase in policyholder float. In 2001 the decrease in
invested assets was primarily attributed to a $6 billion decline in the market values of Berkshire's major equity
investments and $4 billion of dividends paid to Berkshire during the year. Partially offsetting these declines was an
increase in investments resulting from an increase in float generated by insurance operations.
Float represents an estimate of the amount of funds ultimately payable to policyholders that is available for
investment. The total float at December 31, 2002 was approximately $41.2 billion compared to $35.5 billion at
December 31, 2001 and about $27.9 billion at December 31, 2000. Increases in float were achieved at all
underwriting units in 2002. The cost of float, represented by the ratio of the pre-tax underwriting loss over the
average float, was about 1.1% for 2002 as compared to 12.8% for 2001. In 2000, the cost of float was
approximately 6.1%.
During 2002, Berkshire increased its investments in high-yield corporate bonds to approximately $8 billion
at December 31, 2002. Approximately $7 billion of these investments are held by Berkshire insurance subsidiaries
with the remaining portion held by finance subsidiaries. These investments were primarily acquired at distressed
prices. The credit risk associated with these investments is much greater than with other fixed income investments,
which are generally U.S. Government, municipal and mortgage-backed securities. Approximately $4 billion of these
investments were issued by companies in the energy industry and approximately $2 billion were issued by
telecommunications businesses. Berkshire believes that credit losses may eventually occur with respect to some of
these investments. However, the Company also believes that over time these investments will produce reasonable
returns in relation to credit risk.
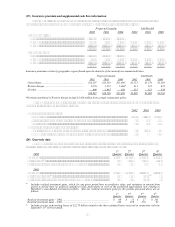
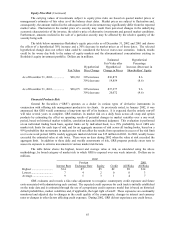
Non-Insurance Businesses
Berkshire's numerous non-insurance businesses grew significantly through the acquisition of a number of
businesses subsequent to December 31, 1999. Additional information regarding these acquisitions is contained in
Notes 2 and 3 of the Consolidated Financial Statements. As a result of these acquisitions, three new non-insurance
business segments were formed in the last two years.
A summary follows of results from Berkshire’ s non-insurance businesses for the past three years.
— (dollars in millions) —
2002 2001 2000
Amount %Amount %Amount %
Revenues ...................................................................... $19,603 100 $16,628 100 $8,903 100
Cost and expenses ........................................................ 16,207 83 14,522 87 7,503 84
Pre-tax earnings............................................................ 3,396 17 2,106 13 1,400 16
Income taxes and minority interest .............................. 1,178 6 801 5 509 6
Net earnings ................................................................. $ 2,218 11 $ 1,305 8 $ 891 10
A comparison of revenues and pre-tax earnings between 2002, 2001 and 2000 for the non-insurance
businesses follows.
— (dollars in millions) —
Revenues Pre-tax earnings (loss)
Non-Insurance Businesses 2002 2001 2000 2002 2001 2000
Apparel.................................................................. $ 1,619 $ 726 $ 678 $ 229 $ (33) $ 6
Building products.................................................. 3,702 3,269 178 516 461 34
Finance and financial products.............................. 2,126 1,658 1,505 1,016 519 530
Flight services ....................................................... 2,837 2,563 2,279 225 186 213
Retail ..................................................................... 2,103 1,998 1,864 166 175 175
Scott Fetzer Companies......................................... 899 914 963 129 129 122
Shaw Industries..................................................... 4,334 4,012 — 424 292 —
Other businesses.................................................... 1,983 1,488 1,436 691 377 320
$19,603 $16,628 $8,903 $3,396 $2,106 $1,400