Berkshire Hathaway 2002 Annual Report Download - page 66
Download and view the complete annual report
Please find page 66 of the 2002 Berkshire Hathaway annual report below. You can navigate through the pages in the report by either clicking on the pages listed below, or by using the keyword search tool below to find specific information within the annual report.-
 1
1 -
2
-
3
-
4
-
5
-
6
-
7
-
8
-
9
-
10
-
11
-
12
-
13
-
14
-
15
-
16
-
17
-
18
-
19
-
20
-
21
-
22
-
23
-
24
-
25
-
26
-
27
-
28
-
29
-
30
-
31
-
32
-
33
-
34
-
35
-
36
-
37
-
38
-
39
-
40
-
41
-
42
-
43
-
44
-
45
-
46
-
47
-
48
-
49
-
50
-
51
-
52
-
53
-
54
-
55
-
 56
56 -
 57
57 -
 58
58 -
 59
59 -
 60
60 -
 61
61 -
 62
62 -
 63
63 -
 64
64 -
 65
65 -
 66
66 -
 67
67 -
 68
68 -
 69
69 -
 70
70 -
 71
71 -
 72
72 -
 73
73 -
 74
74 -
 75
75 -
 76
76 -
77
-
78
 |
 |

65
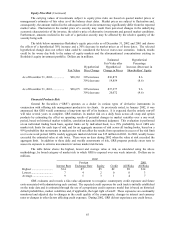
Equity Price Risk (Continued)
The carrying values of investments subject to equity price risks are based on quoted market prices or
management's estimates of fair value as of the balance sheet dates. Market prices are subject to fluctuation and,
consequently, the amount realized in the subsequent sale of an investment may significantly differ from the reported
market value. Fluctuation in the market price of a security may result from perceived changes in the underlying
economic characteristics of the investee, the relative price of alternative investments and general market conditions.
Furthermore, amounts realized in the sale of a particular security may be affected by the relative quantity of the
security being sold.
The table below summarizes Berkshire's equity price risks as of December 31, 2002 and 2001 and shows
the effects of a hypothetical 30% increase and a 30% decrease in market prices as of those dates. The selected
hypothetical change does not reflect what could be considered the best or worst case scenarios. Indeed, results
could be far worse due both to the nature of equity markets and the aforementioned concentrations existing in
Berkshire's equity investment portfolio. Dollars are in millions.
Estimated Hypothetical
Fair Value after Percentage
Hypothetical Hypothetical Increase (Decrease) in
Fair Value Price Change Change in Prices Shareholders’ Equity
As of December 31, 2002................. $28,363 30% increase $36,872 8.6
30% decrease 19,854 (8.6)
As of December 31, 2001................. $28,675 30% increase $37,277 9.6
30% decrease 20,072 (9.6)
Financial Products Risk
General Re Securities (“GRS”) operates as a dealer in various types of derivative instruments in
conjunction with offering risk management products to its clients. As previously noted, in January 2002, it was
announced that GRS would commence a long-term run off of its business. It is expected that the orderly run-off
will take several years to complete. GRS monitors its market risk on a daily basis across all swap and option
products by estimating the effect on operating results of potential changes in market variables over a one week
period, based on historical market volatility, correlation data and informed judgment. This evaluation is performed
on an individual trading book basis, against limits set by individual book, to a 99% probability level. GRS sets
market risk limits for each type of risk, and for an aggregate measure of risk across all trading books, based on a
99% probability that movements in market rates will not affect the results from operations in excess of the risk limit
over a one week period. GRS's weekly aggregate market risk limit was $15 million in 2002. In 2002, weekly losses
exceeded the estimated value at risk twice. There were no days during 2002 when the value at risk exceeded the
aggregate limit. In addition to these daily and weekly assessments of risk, GRS prepares periodic stress tests to
assess its exposure to extreme movements in various market risk factors.
The table below shows the highest, lowest and average value at risk, as calculated using the above
methodology, by broad category of market risk to which GRS is exposed over one week intervals. Dollars are in
millions.
2002
Foreign 2001
Interest Rate Exchange Rate Equity Credit All Risks All Risks
Highest ............................. $14 $7 $5 $2 $9 $14
Lowest.............................. 7 4 2 0 0 3
Average ............................ 9 5 3 1 4 7
GRS evaluates and records a fair-value adjustment to recognize counterparty credit exposure and future
costs associated with administering each contract. The expected credit exposure for each trade is initially established
on the trade date and is estimated through the use of a proprietary credit exposure model that is based on historical
default probabilities, market volatilities and, if applicable, the legal right of setoff. These exposures are continually
monitored and adjusted due to changes in the credit quality of the counterparty, changes in interest and currency
rates or changes in other factors affecting credit exposure. During 2002, GRS did not experience any credit losses.