Berkshire Hathaway 2002 Annual Report Download - page 50
Download and view the complete annual report
Please find page 50 of the 2002 Berkshire Hathaway annual report below. You can navigate through the pages in the report by either clicking on the pages listed below, or by using the keyword search tool below to find specific information within the annual report.-
 1
1 -
2
-
3
-
4
-
5
-
6
-
7
-
8
-
9
-
10
-
11
-
12
-
13
-
14
-
15
-
16
-
17
-
18
-
19
-
20
-
21
-
22
-
23
-
24
-
25
-
26
-
27
-
28
-
29
-
30
-
31
-
32
-
33
-
34
-
35
-
36
-
37
-
38
-
39
-
 40
40 -
 41
41 -
 42
42 -
 43
43 -
 44
44 -
 45
45 -
 46
46 -
 47
47 -
 48
48 -
 49
49 -
 50
50 -
 51
51 -
 52
52 -
 53
53 -
 54
54 -
 55
55 -
 56
56 -
 57
57 -
 58
58 -
 59
59 -
 60
60 -
61
-
62
-
63
-
64
-
65
-
66
-
67
-
68
-
69
-
70
-
71
-
72
-
73
-
74
-
75
-
76
-
77
-
78
 |
 |

49
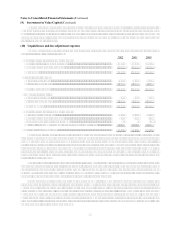
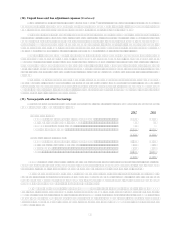
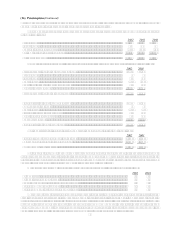
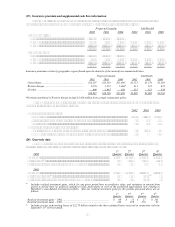
(18) Business segment data (Continued)
A disaggregation of Berkshires consolidated data for each of the three most recent years is presented in the tables
which follow on this and the following page. Amounts are in millions.
Operating Businesses: Revenues
Insurance group: 2002 2001 2000
Premiums earned:
GEICO.................................................................................................... $ 6,670 $ 6,060 $ 5,610
General Re.............................................................................................. 8,500 8,353 8,696
Berkshire Hathaway Reinsurance Group................................................ 3,300 2,991 4,712
Berkshire Hathaway Primary Group....................................................... 712 501 325
Investment income..................................................................................... 3,067 2,844 2,796
Total insurance group................................................................................... 22,249 20,749 22,139
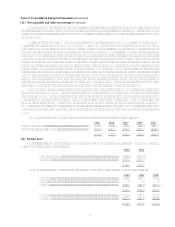
Apparel......................................................................................................... 1,619 726 678
Building products ......................................................................................... 3,702 3,269 178
Finance and financial products..................................................................... 2,126 1,658 1,505
Flight services .............................................................................................. 2,837 2,563 2,279
Retail ............................................................................................................ 2,103 1,998 1,864
Scott Fetzer Companies................................................................................ 899 914 963
Shaw Industries ............................................................................................ 4,334 4,012
Other businesses........................................................................................... 1,983 1,488 1,436
41,852 37,377 31,042
Reconciliation of segments to consolidated amount:
Realized investment gains ......................................................................... 637 1,363 3,955
Other revenues........................................................................................... 29 35 54
Eliminations............................................................................................... (56) (65) (26)
Purchase-accounting adjustments.............................................................. (109) (67) (136)
$42,353 $38,643 $34,889
Operating Businesses: Operating Profit before taxes
Insurance group operating profit: 2002 2001 2000
Underwriting profit (loss):
GEICO.................................................................................................... $ 416 $ 221 $ (224)
General Re.............................................................................................. (1,393) (3,671) (1,254)
Berkshire Hathaway Reinsurance Group................................................ 534 (647) (162)
Berkshire Hathaway Primary Group....................................................... 32 30 25
Net investment income.............................................................................. 3,050 2,824 2,773
Total insurance group operating profit (loss) ............................................... 2,639 (1,243) 1,158
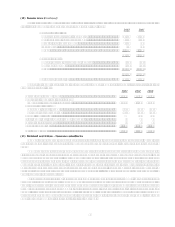
Apparel......................................................................................................... 229 (33) 6
Building products ......................................................................................... 516 461 34
Finance and financial products..................................................................... 1,016 519 530
Flight services .............................................................................................. 225 186 213
Retail ............................................................................................................ 166 175 175
Scott Fetzer Companies................................................................................ 129 129 122
Shaw Industries ............................................................................................ 424 292
Other businesses........................................................................................... 691 377 320
6,035 863 2,558
Reconciliation of segments to consolidated amount:
Realized investment gains ......................................................................... 603 1,320 3,955
Interest expense* ....................................................................................... (86) (92) (92)
Corporate and other................................................................................... 2 8 22
Goodwill amortization and other purchase-accounting adjustments ......... (119) (630) (856)
$ 6,435 $ 1,469 $ 5,587
* Amounts of interest expense represent interest on borrowings under investment agreements and other debt
exclusive of that of finance and financial products businesses and interest allocated to certain other businesses.