BP 2009 Annual Report Download - page 65
Download and view the complete annual report
Please find page 65 of the 2009 BP annual report below. You can navigate through the pages in the report by either clicking on the pages listed below, or by using the keyword search tool below to find specific information within the annual report.-
 1
1 -
2
-
3
-
4
-
5
-
6
-
7
-
8
-
9
-
10
-
11
-
12
-
13
-
14
-
15
-
16
-
17
-
18
-
19
-
20
-
21
-
22
-
23
-
24
-
25
-
26
-
27
-
28
-
29
-
30
-
31
-
32
-
33
-
34
-
35
-
36
-
37
-
38
-
39
-
40
-
41
-
42
-
43
-
44
-
45
-
46
-
47
-
48
-
49
-
50
-
51
-
52
-
53
-
54
-
 55
55 -
 56
56 -
 57
57 -
 58
58 -
 59
59 -
 60
60 -
 61
61 -
 62
62 -
 63
63 -
 64
64 -
 65
65 -
 66
66 -
 67
67 -
 68
68 -
 69
69 -
 70
70 -
 71
71 -
 72
72 -
 73
73 -
 74
74 -
 75
75 -
76
-
77
-
78
-
79
-
80
-
81
-
82
-
83
-
84
-
85
-
86
-
87
-
88
-
89
-
90
-
91
-
92
-
93
-
94
-
95
-
96
-
97
-
98
-
99
-
100
-
101
-
102
-
103
-
104
-
105
-
106
-
107
-
108
-
109
-
110
-
111
-
112
-
113
-
114
-
115
-
116
-
117
-
118
-
119
-
120
-
121
-
122
-
123
-
124
-
125
-
126
-
127
-
128
-
129
-
130
-
131
-
132
-
133
-
134
-
135
-
136
-
137
-
138
-
139
-
140
-
141
-
142
-
143
-
144
-
145
-
146
-
147
-
148
-
149
-
150
-
151
-
152
-
153
-
154
-
155
-
156
-
157
-
158
-
159
-
160
-
161
-
162
-
163
-
164
-
165
-
166
-
167
-
168
-
169
-
170
-
171
-
172
-
173
-
174
-
175
-
176
-
177
-
178
-
179
-
180
-
181
-
182
-
183
-
184
-
185
-
186
-
187
-
188
-
189
-
190
-
191
-
192
-
193
-
194
-
195
-
196
-
197
-
198
-
199
-
200
-
201
-
202
-
203
-
204
-
205
-
206
-
207
-
208
-
209
-
210
-
211
-
212
 |
 |

BP Annual Report and Accounts 2009
Business review
Business review
Business review
63
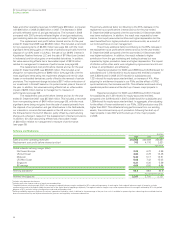
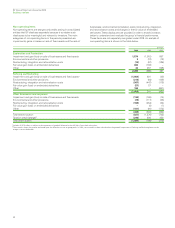
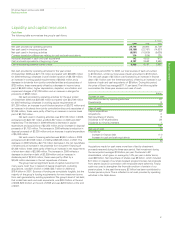
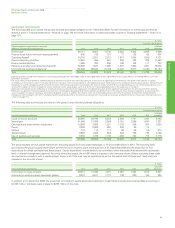
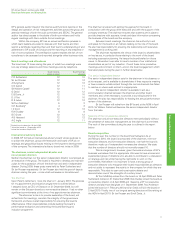
Contractual commitments
The following table summarizes the group’s principal contractual obligations at 31 December 2009. Further information on borrowings and finance
leases is given in Financial statements – Note 32 on page 158 and more information on operating leases is given in Financial statements – Note 12 on
page 134.
$ million
Payments due by period
Expected payments by period under contractual 2015 and
obligations and commercial commitments Total 2010 2011 2012 2013 2014 thereafter
Borrowingsa36,717 9,681 6,740 5,282 5,463 3,085 6,466
Finance lease future minimum lease payments 845 109 121 77 65 66 407
Operating leasesb14,716 3,251 2,513 1,977 1,604 1,240 4,131
Decommissioning liabilities 13,261 364 261 356 428 389 11,463
Environmental liabilities 1,860 385 256 193 152 117 757
Pensions and other post-retirement benefitsc26,855 1,647 1,890 1,887 1,884 1,491 18,056
Unconditional purchase obligationsd155,356 92,536 16,189 10,420 6,677 5,350 24,184
Total 249,610 107,973 27,970 20,192 16,273 11,738 65,464
aExpected payments include interest payments on borrowings totalling $2,679 million ($662 million in 2010, $508 million in 2011, $379 million in 2012, $262 million in 2013, $168 million in 2014 and
$700 million thereafter).
bThe future minimum lease payments are before deducting related rental income from operating sub-leases. In the case of an operating lease entered into solely by BP as the operator of a jointly
controlled asset, the amounts shown in the table represent the net future minimum lease payments, after deducting amounts reimbursed, or to be reimbursed, by joint venture partners. Where BP is not
the operator of a jointly controlled asset BP’s share of the future minimum lease payments are included in the amounts shown, whether BP has co-signed the lease or not. Where operating lease costs
are incurred in relation to the hire of equipment used in connection with a capital project, some or all of the cost may be capitalized as part of the capital cost of the project.
cRepresents the expected future contributions to funded pension plans and payments by the group for unfunded pension plans and the expected future payments for other post-retirement benefits.
dRepresents any agreement to purchase goods or services that is enforceable and legally binding and that specifies all significant terms. The amounts shown include arrangements to secure long-term
access to supplies of crude oil, natural gas, feedstocks and pipeline systems. In addition, the amounts shown for 2010 include purchase commitments existing at 31 December 2009 entered into
principally to meet the group’s short-term manufacturing and marketing requirements. The price risk associated with these crude oil, natural gas and power contracts is discussed in Financial statements
– Note 24 on page 144.
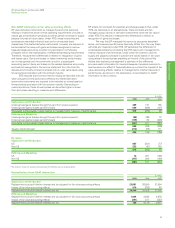
The following table summarizes the nature of the group’s unconditional purchase obligations.
$ million
Payments due by period
2015 and
Unconditional purchase obligations Total 2010 2011 2012 2013 2014 thereafter
Crude oil and oil products 80,991 62,794 6,352 3,894 1,787 1,001 5,163
Natural gas 41,680 21,038 5,598 3,150 2,386 1,957 7,551
Chemicals and other refinery feedstocks 10,939 2,909 1,521 1,183 849 824 3,653
Power 3,846 2,969 591 236 36 14 –
Utilities 718 112 111 93 69 59 274
Transportation 8,923 1,005 858 806 766 723 4,765
Use of facilities and services 8,259 1,709 1,158 1,058 784 772 2,778
Total 155,356 92,536 16,189 10,420 6,677 5,350 24,184
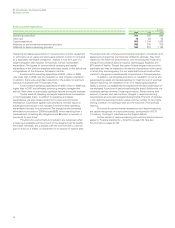
The group expects its total capital expenditure, excluding acquisitions and asset exchanges, to be around $20 billion in 2010. The following table
summarizes the group’s capital expenditure commitments for property, plant and equipment at 31 December 2009 and the proportion of that
expenditure for which contracts have been placed. Capital expenditure is considered to be committed when the project has received the appropriate
level of internal management approval. For jointly controlled assets, the net BP share is included in the amounts shown. Where operating lease costs
are incurred in connection with a capital project, some or all of the cost may be capitalized as part of the capital cost of the project. Such costs are
included in the amounts shown.
$ million
2015 and
Capital expenditure commitments Total 2010 2011 2012 2013 2014 thereafter
Committed on major projects 29,451 13,406 7,071 3,091 1,624 1,618 2,641
Amounts for which contracts have been placed 9,812 6,611 1,713 748 320 195 225
In addition, at 31 December 2009, the group had committed to capital expenditure relating to investments in equity-accounted entities amounting to
$1,038 million. Contracts were in place for $792 million of this total.