BP 2009 Annual Report Download - page 38
Download and view the complete annual report
Please find page 38 of the 2009 BP annual report below. You can navigate through the pages in the report by either clicking on the pages listed below, or by using the keyword search tool below to find specific information within the annual report.-
 1
1 -
2
-
3
-
4
-
5
-
6
-
7
-
8
-
9
-
10
-
11
-
12
-
13
-
14
-
15
-
16
-
17
-
18
-
19
-
20
-
21
-
22
-
23
-
24
-
25
-
26
-
27
-
 28
28 -
 29
29 -
 30
30 -
 31
31 -
 32
32 -
 33
33 -
 34
34 -
 35
35 -
 36
36 -
 37
37 -
 38
38 -
 39
39 -
 40
40 -
 41
41 -
 42
42 -
 43
43 -
 44
44 -
 45
45 -
 46
46 -
 47
47 -
 48
48 -
49
-
50
-
51
-
52
-
53
-
54
-
55
-
56
-
57
-
58
-
59
-
60
-
61
-
62
-
63
-
64
-
65
-
66
-
67
-
68
-
69
-
70
-
71
-
72
-
73
-
74
-
75
-
76
-
77
-
78
-
79
-
80
-
81
-
82
-
83
-
84
-
85
-
86
-
87
-
88
-
89
-
90
-
91
-
92
-
93
-
94
-
95
-
96
-
97
-
98
-
99
-
100
-
101
-
102
-
103
-
104
-
105
-
106
-
107
-
108
-
109
-
110
-
111
-
112
-
113
-
114
-
115
-
116
-
117
-
118
-
119
-
120
-
121
-
122
-
123
-
124
-
125
-
126
-
127
-
128
-
129
-
130
-
131
-
132
-
133
-
134
-
135
-
136
-
137
-
138
-
139
-
140
-
141
-
142
-
143
-
144
-
145
-
146
-
147
-
148
-
149
-
150
-
151
-
152
-
153
-
154
-
155
-
156
-
157
-
158
-
159
-
160
-
161
-
162
-
163
-
164
-
165
-
166
-
167
-
168
-
169
-
170
-
171
-
172
-
173
-
174
-
175
-
176
-
177
-
178
-
179
-
180
-
181
-
182
-
183
-
184
-
185
-
186
-
187
-
188
-
189
-
190
-
191
-
192
-
193
-
194
-
195
-
196
-
197
-
198
-
199
-
200
-
201
-
202
-
203
-
204
-
205
-
206
-
207
-
208
-
209
-
210
-
211
-
212
 |
 |

36
BP Annual Report and Accounts 2009
Business review
Refining and Marketing
Our Refining and Marketing business is responsible for the supply and
trading, refining, manufacturing, marketing and transportation of crude
oil, petroleum, petrochemicals products and related services to
wholesale and retail customers. BP markets its products in more than
80 countries. We have significant operations in Europe and North
America and also manufacture and market our products across
Australasia, in China and other parts of Asia, Africa and Central and
South America.
Our organization is managed through two main business
groupings: fuels value chains (FVCs) and international businesses (IBs).
The FVCs integrate the activities of refining, logistics, marketing, supply
and trading, on a regional basis, recognizing the geographic nature of the
markets in which we compete. This provides the opportunity to optimize
our activities from crude oil purchases to end-consumer sales through our
physical assets (refineries, terminals, pipelines and retail stations). The
IBs include the manufacturing, supply and marketing of lubricants,
petrochemicals, aviation fuels and liquefied petroleum gas (LPG).
Our market
The 2009 operating environment was again challenging. Global oil
demand contracted by approximately 1.3 million barrels per day with
demand in the OECD falling for the fourth consecutive year. Crude oil
prices more than doubled during the course of the year, from a dated
Brent price of $36.55 per barrel on 1 January 2009 to $77.67 per barrel at
the end of 2009, contributing to margin volatility.
Refining margins fell sharply in 2009 as demand for oil products
reduced in the wake of the global economic recession and new refining
capacity came onstream, mostly in Asia. During 2009, distillate
inventories were consistently above the top of the range of the past five
years. Gasoline inventories grew steadily and were generally at or slightly
above the average level of the past five years. As a result, the BP global
indicator refining margin (GIM) averaged $4 per barrel in 2009, down
$2.50 per barrel compared with 2008, with the average for the fourth-
quarter of 2009 at only $1.49 per barrel, the lowest for almost 15 years.
This margin decline had a significant adverse impact on the financial
performance of the segment.
In Europe, where diesel accounts for a large proportion of regional
demand, refining margins were hit by reduced demand from commercial
transport because of the economic recession. In the US, where refining is
more highly upgraded and the transport market is more gasoline oriented,
margins deteriorated less. Refining margins in Asia Pacific were the
hardest hit due to substantial additions to refining capacity in the region.
During 2009, upgrading margins were particularly poor due to
stronger relative fuel oil prices and narrow light-heavy crude spreads. This
adversely impacted our highly upgraded refineries and had an adverse
impact on our financial performance in 2009 compared with 2008.
The end of 2008 and the first quarter of 2009 saw unprecedented
levels of market volatility, driven by turmoil in the financial sector and
disruptions in the supply chain resulting from the economic downturn.
This high level of volatility, combined with our proprietary asset base and
trading skills, enabled us to deliver a particularly strong supply and trading
result in the first quarter of 2009. Subsequent to the first quarter,
volatility returned to more normal levels.
In our IBs, we saw a decline in demand for lubricants due to the
financial crisis. During the year we saw a partial recovery in the demand
for our petrochemicals products.
Our strategy
Our purpose is to be the product- and service-led arm of BP, focused on
fuels, lubricants, petrochemicals products and related services. We aim
to be excellent in the markets we choose to be in – those that allow BP
to serve the major energy markets of the world. We are in pursuit of
competitive returns and enduring growth, as we serve customers and
promote BP and our brands through quality products.
We believe that key to our continued success in Refining and
Marketing is holding a portfolio of quality, integrated, efficient positions
and accessing available market growth in emerging markets. We intend
to do this through holding positions in advantaged integrated FVCs where
we will invest to strengthen our established positions. We also intend to
retain and grow our IBs.
In 2007, we identified that the segment’s financial performance
lagged that of our competitors, based on our analysis of our position
compared with our supermajor peers, and we launched a programme to
restore our financial performance. Our objective was to restore our
performance over a period of three to four years by focusing on achieving
safe, reliable and compliant operations, restoring missing revenues and
delivering sustainable competitive returns and cash flows.
We believe our overall performance has now returned to being
competitive with our supermajor peers, but that there is significant
potential for further performance improvements. In the future, we intend
to build on this by focusing on further improvements in operations, asset
quality and overall efficiency, in order to be a leading player in each of the
markets in which we choose to participate.
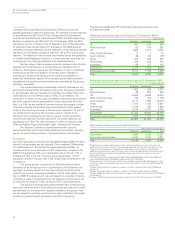
Our performance
Our 2009 performance has benefited from the fundamental
improvements we have been making across the business, including the
measures we have taken to restore the availability of our refining system,
reduce costs and simplify the organization. The replacement cost profit
before interest and tax was $0.7 billion for 2009, compared with
$4.2 billion in 2008. The result was heavily impacted by non-operating
items, which included a significant level of restructuring charges and a
$1.6 billion one-off charge to write off all the segment’s goodwill in the
US West Coast FVC relating to our 2000 ARCO acquisition. This resulted
from our annual review of goodwill as required under IFRS and reflects
the prevailing weak refining environment that, together with a review of
future margin expectations in the FVC, has led to a reduction in the
expected future cash flows. The decrease in profit was also driven by the
very significantly weaker environment, where refining margins fell by
almost 40%. This was partly offset by significantly stronger operational
performance in the fuels value chains, with 93.6% Solomon refining
availability, lower costs and improved performance in the international
businesses. Our financial results are discussed in more detail on
pages 56-57.
Safety, both process and personal, remains our top priority. During
2009, we continued the migration to the BP operating management
system (OMS) with a continuing focus on process safety. The OMS is
described in further detail in Safety (see page 46). At the end of 2009, all
our operated refineries and petrochemicals plants were using the OMS.
Within our US refineries, we continued to implement the
recommendations of the BP US Refineries Independent Safety Review
Panel and regulatory bodies (further information can be found in Safety
on page 46 and in Legal proceedings on page 99). The focus on
operational integrity continues to yield positive results across the
segment. Since 2005, when we started identifying incidents by type, we
have reduced the overall number of major incidents by 90%. None of the
major incidents reported in 2009 was integrity-management related. We
have also reduced the number of reported oil spills and the recordable
injury frequency in our workforce to the lowest level for 10 years. In
2009, there were no reported workforce fatalities associated with our
refining and marketing operations.