BP 2009 Annual Report Download - page 147
Download and view the complete annual report
Please find page 147 of the 2009 BP annual report below. You can navigate through the pages in the report by either clicking on the pages listed below, or by using the keyword search tool below to find specific information within the annual report.-
 1
1 -
2
-
3
-
4
-
5
-
6
-
7
-
8
-
9
-
10
-
11
-
12
-
13
-
14
-
15
-
16
-
17
-
18
-
19
-
20
-
21
-
22
-
23
-
24
-
25
-
26
-
27
-
28
-
29
-
30
-
31
-
32
-
33
-
34
-
35
-
36
-
37
-
38
-
39
-
40
-
41
-
42
-
43
-
44
-
45
-
46
-
47
-
48
-
49
-
50
-
51
-
52
-
53
-
54
-
55
-
56
-
57
-
58
-
59
-
60
-
61
-
62
-
63
-
64
-
65
-
66
-
67
-
68
-
69
-
70
-
71
-
72
-
73
-
74
-
75
-
76
-
77
-
78
-
79
-
80
-
81
-
82
-
83
-
84
-
85
-
86
-
87
-
88
-
89
-
90
-
91
-
92
-
93
-
94
-
95
-
96
-
97
-
98
-
99
-
100
-
101
-
102
-
103
-
104
-
105
-
106
-
107
-
108
-
109
-
110
-
111
-
112
-
113
-
114
-
115
-
116
-
117
-
118
-
119
-
120
-
121
-
122
-
123
-
124
-
125
-
126
-
127
-
128
-
129
-
130
-
131
-
132
-
133
-
134
-
135
-
136
-
 137
137 -
 138
138 -
 139
139 -
 140
140 -
 141
141 -
 142
142 -
 143
143 -
 144
144 -
 145
145 -
 146
146 -
 147
147 -
 148
148 -
 149
149 -
 150
150 -
 151
151 -
 152
152 -
 153
153 -
 154
154 -
 155
155 -
 156
156 -
 157
157 -
158
-
159
-
160
-
161
-
162
-
163
-
164
-
165
-
166
-
167
-
168
-
169
-
170
-
171
-
172
-
173
-
174
-
175
-
176
-
177
-
178
-
179
-
180
-
181
-
182
-
183
-
184
-
185
-
186
-
187
-
188
-
189
-
190
-
191
-
192
-
193
-
194
-
195
-
196
-
197
-
198
-
199
-
200
-
201
-
202
-
203
-
204
-
205
-
206
-
207
-
208
-
209
-
210
-
211
-
212
 |
 |

24. Financial instruments and financial risk factors continued
–
1
2
BP Annual Report and Accounts 2009
Notes on financial statements
Financial statements
145
In addition, the integrated supply and trading function undertakes derivative activity for risk management purposes under a separate control framework
as described more fully below.
(a) Market risk
Market risk is the risk or uncertainty arising from possible market price movements and their impact on the future performance of a business. The
market price movements that the group is exposed to include oil, natural gas and power prices (commodity price risk), foreign currency exchange
rates, interest rates, equity prices and other indices that could adversely affect the value of the group’s financial assets, liabilities or expected future
cash flows. The group enters into derivatives in a well established entrepreneurial trading operation. In addition, the group has developed a control
framework aimed at managing the volatility inherent in certain of its natural business exposures. In accordance with this control framework the group
enters into various transactions using derivatives for risk management purposes.
The group measures market risk exposure arising from its trading positions using value-at-risk techniques. These techniques are based on a
variance/covariance model or a Monte Carlo simulation and make a statistical assessment of the market risk arising from possible future changes in
market prices over a 24-hour period. The calculation of the range of potential changes in fair value takes into account a snapshot of the end-of-day
exposures and the history of one-day price movements, together with the correlation of these price movements. The value-at-risk measure is
supplemented by stress testing and tail risk analysis.
The trading value-at-risk model is used for derivative financial instrument types such as: interest rate forward and futures contracts, swap
agreements, options and swaptions; foreign exchange forward and futures contracts, swap agreements and options; and oil, natural gas and power
price forwards, futures, swap agreements and options. Additionally, where physical commodities or non-derivative forward contracts are held as part of
a trading position, they are also reflected in the value-at-risk model. For options, a linear approximation is included in the value-at-risk models when full
revaluation is not possible.
The value-at-risk table does not incorporate any of the group’s natural business exposures or any derivatives entered into to risk manage those
exposures. Market risk exposure in respect of embedded derivatives is also not included in the value-at-risk table. Instead separate sensitivity analyses
are disclosed below.
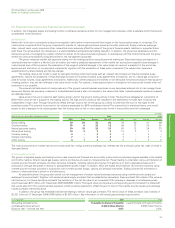
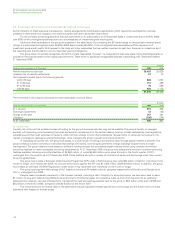
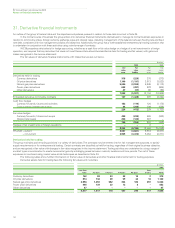
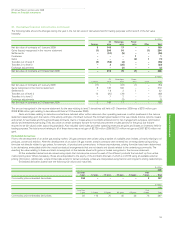
Value-at-risk limits are in place for each trading activity and for the group’s trading activity in total. The board has delegated an overall limit of
$100 million value at risk in support of this trading activity. The high and low values at risk indicated in the table below for each type of activity are
independent of each other. Through the portfolio effect the high value at risk for the group as a whole is lower than the sum of the highs for the
constituent parts. The potential movement in fair values is expressed to a 95% confidence interval. This means that, in statistical terms, one would
expect to see a decrease in fair values greater than the trading value at risk on one occasion per month if the portfolio were left unchanged.
$ million
Value at risk for 1 day at 95% confidence interval 2009 2008
High Low Average Year end High Low Average Year end
Group trading 79 24 45 30 76 20 37 69
Oil price trading 75 9 29 12 69 12 25 63
Natural gas price trading 70 15 33 31 50 12 24 23
Power price trading 14 3 5 5 14 3 7 4
Currency trading 4– 2 2 4–2
Interest rate trading 7– 3 3 7–2
Other trading 41 2 3 512
The major components of market risk are commodity price risk, foreign currency exchange risk, interest rate risk and equity price risk, each of which is
discussed below.
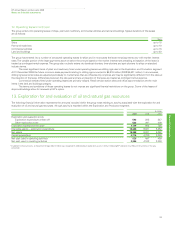
(i) Commodity price risk
The group’s integrated supply and trading function uses conventional financial and commodity instruments and physical cargoes available in the related
commodity markets. Oil and natural gas swaps, options and futures are used to mitigate price risk. Power trading is undertaken using a combination of
over-the-counter forward contracts and other derivative contracts, including options and futures. This activity is on both a standalone basis and in
conjunction with gas derivatives in relation to gas-generated power margin. In addition, NGLs are traded around certain US inventory locations using
over-the-counter forward contracts in conjunction with over-the-counter swaps, options and physical inventories. Trading value-at-risk information in
relation to these activities is shown in the table above.
As described above, the group also carries out risk management of certain natural business exposures using over-the-counter swaps and
exchange futures contracts. Together with certain physical supply contracts that are classified as derivatives, these contracts fall outside of the value-at-
risk framework. For these derivative contracts the sensitivity of the net fair value to an immediate 10% increase or decrease in all reference prices
would have been $73 million at 31 December 2009 (2008 $90 million). This figure does not include any corresponding economic benefit or disbenefit
that would arise from the natural business exposure which would be expected to offset the gain or loss on the over-the-counter swaps and exchange
futures contracts mentioned above.
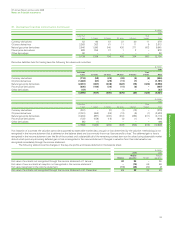
In addition, the group has embedded derivatives relating to certain natural gas contracts. The net fair value of these contracts was a liability of
$1,331 million at 31 December 2009 (2008 liability of $1,867 million). Key information on the natural gas contracts is given below.
At 31 December 2009 2008
Remaining contract terms 9 months to 8 years 9 months 1 year 9 months to 9 years 9 months
Contractual/notional amount 2,460 million therms 3,585 million therms
Discount rate – nominal risk free 4.0% 2.5%