BP 2009 Annual Report Download - page 194
Download and view the complete annual report
Please find page 194 of the 2009 BP annual report below. You can navigate through the pages in the report by either clicking on the pages listed below, or by using the keyword search tool below to find specific information within the annual report.-
 1
1 -
 2
2 -
 3
3 -
 4
4 -
 5
5 -
 6
6 -
 7
7 -
 8
8 -
 9
9 -
 10
10 -
 11
11 -
 12
12 -
 13
13 -
 14
14 -
 15
15 -
 16
16 -
 17
17 -
 18
18 -
 19
19 -
 20
20 -
 21
21 -
 22
22 -
 23
23 -
 24
24 -
 25
25 -
 26
26 -
 27
27 -
 28
28 -
 29
29 -
 30
30 -
 31
31 -
 32
32 -
 33
33 -
 34
34 -
 35
35 -
 36
36 -
 37
37 -
 38
38 -
 39
39 -
 40
40 -
 41
41 -
 42
42 -
 43
43 -
 44
44 -
 45
45 -
 46
46 -
 47
47 -
 48
48 -
 49
49 -
 50
50 -
 51
51 -
 52
52 -
 53
53 -
 54
54 -
 55
55 -
 56
56 -
 57
57 -
 58
58 -
 59
59 -
 60
60 -
 61
61 -
 62
62 -
 63
63 -
 64
64 -
 65
65 -
 66
66 -
 67
67 -
 68
68 -
 69
69 -
 70
70 -
 71
71 -
 72
72 -
 73
73 -
 74
74 -
 75
75 -
 76
76 -
 77
77 -
 78
78 -
 79
79 -
 80
80 -
 81
81 -
 82
82 -
 83
83 -
 84
84 -
 85
85 -
 86
86 -
 87
87 -
 88
88 -
 89
89 -
 90
90 -
 91
91 -
 92
92 -
 93
93 -
 94
94 -
 95
95 -
 96
96 -
 97
97 -
 98
98 -
 99
99 -
 100
100 -
 101
101 -
 102
102 -
 103
103 -
 104
104 -
 105
105 -
 106
106 -
 107
107 -
 108
108 -
 109
109 -
 110
110 -
 111
111 -
 112
112 -
 113
113 -
 114
114 -
 115
115 -
 116
116 -
 117
117 -
 118
118 -
 119
119 -
 120
120 -
 121
121 -
 122
122 -
 123
123 -
 124
124 -
 125
125 -
 126
126 -
 127
127 -
 128
128 -
 129
129 -
 130
130 -
 131
131 -
 132
132 -
 133
133 -
 134
134 -
 135
135 -
 136
136 -
 137
137 -
 138
138 -
 139
139 -
 140
140 -
 141
141 -
 142
142 -
 143
143 -
 144
144 -
 145
145 -
 146
146 -
 147
147 -
 148
148 -
 149
149 -
 150
150 -
 151
151 -
 152
152 -
 153
153 -
 154
154 -
 155
155 -
 156
156 -
 157
157 -
 158
158 -
 159
159 -
 160
160 -
 161
161 -
 162
162 -
 163
163 -
 164
164 -
 165
165 -
 166
166 -
 167
167 -
 168
168 -
 169
169 -
 170
170 -
 171
171 -
 172
172 -
 173
173 -
 174
174 -
 175
175 -
 176
176 -
 177
177 -
 178
178 -
 179
179 -
 180
180 -
 181
181 -
 182
182 -
 183
183 -
 184
184 -
 185
185 -
 186
186 -
 187
187 -
 188
188 -
 189
189 -
 190
190 -
 191
191 -
 192
192 -
 193
193 -
 194
194 -
 195
195 -
 196
196 -
 197
197 -
 198
198 -
 199
199 -
 200
200 -
 201
201 -
 202
202 -
 203
203 -
 204
204 -
 205
205 -
 206
206 -
 207
207 -
 208
208 -
 209
209 -
 210
210 -
 211
211 -
 212
212
 |
 |

192
BP Annual Report and Accounts 2009
Supplementary information on oil and natural gas (unaudited)
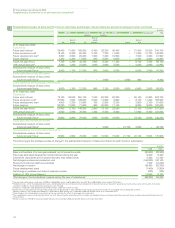
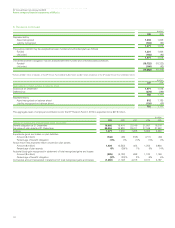
Net oil and gas wells completed or abandoned
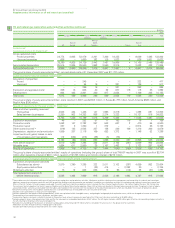
The following table shows the number of net productive and dry exploratory and development oil and natural gas wells completed or abandoned in the
years indicated by the group and its equity-accounted entities. Productive wells include wells in which hydrocarbons were encountered and the drilling
or completion of which, in the case of exploratory wells, has been suspended pending further drilling or evaluation. A dry well is one found to be
incapable of producing hydrocarbons in sufficient quantities to justify completion.
Europe North South Africa Asia Australasia Total
America America
Rest of
Rest of North Rest of
UK Europe US America Russia Asia
2009
Exploratory
Productive 0.1 – 47.2 – 3.0 4.5 7.0 5.3 0.6 67.7
Dry 0.2 – 4.2 – – 1.4 4.5 6.0 0.2 16.5
Development
Productive 9.3 1.5 403.8 17.9 135.4 20.8 293.0 45.8 1.6 929.1
Dry – – 3.3 – – 0.5 4.0 0.4 0.6 8.8
2008
Exploratory
Productive 0.8 – 2.4 – 4.4 4.3 12.5 0.5 0.6 25.5
Dry – 0.5 0.9 0.1 0.4 2.6 23.0 0.5 0.4 28.4
Development
Productive 6.6 0.5 379.8 28.3 112.5 18.6 10.0 45.4 4.5 606.2
Dry 0.2 – 1.1 0.9 2.9 1.5 19.5 2.1 – 28.2
2007
Exploratory
Productive 1.6 – 4.1 0.5 – 6.1 16.0 1.7 1.1 31.1
Dry – – 0.7 0.5 – 1.6 9.0 1.4 – 13.2
Development
Productive 0.4 0.8 401.2 36.0 10.0 15.3 246.0 27.5 2.1 739.3
Dry 0.6 – 4.2 8.8 – – 9.5 – – 23.1
Drilling and production activities in progress
The following table shows the number of exploratory and development oil and natural gas wells in the process of being drilled by the group and its equity-
accounted entities as at 31 December 2009. Suspended development wells and long-term suspended exploratory wells are also included in the table.
Europe North South Africa Asia Australasia Total
America America
Rest of
Rest of North Rest of
UK Europe US America Russia Asia
At 31 December 2009
Exploratory
Gross – – 112.0 4.0 – 5.0 8.0 3.0 – 132.0
Net – – 30.2 1.8 – 2.6 4.0 2.0 – 40.6
Development
Gross 4.0 1.0 366.0 30.0 15.0 23.0 45.0 16.0 – 500.0
Net 2.7 0.3 176.9 19.8 9.2 7.5 20.0 3.4 – 239.8
