BP 2009 Annual Report Download - page 133
Download and view the complete annual report
Please find page 133 of the 2009 BP annual report below. You can navigate through the pages in the report by either clicking on the pages listed below, or by using the keyword search tool below to find specific information within the annual report.-
 1
1 -
2
-
3
-
4
-
5
-
6
-
7
-
8
-
9
-
10
-
11
-
12
-
13
-
14
-
15
-
16
-
17
-
18
-
19
-
20
-
21
-
22
-
23
-
24
-
25
-
26
-
27
-
28
-
29
-
30
-
31
-
32
-
33
-
34
-
35
-
36
-
37
-
38
-
39
-
40
-
41
-
42
-
43
-
44
-
45
-
46
-
47
-
48
-
49
-
50
-
51
-
52
-
53
-
54
-
55
-
56
-
57
-
58
-
59
-
60
-
61
-
62
-
63
-
64
-
65
-
66
-
67
-
68
-
69
-
70
-
71
-
72
-
73
-
74
-
75
-
76
-
77
-
78
-
79
-
80
-
81
-
82
-
83
-
84
-
85
-
86
-
87
-
88
-
89
-
90
-
91
-
92
-
93
-
94
-
95
-
96
-
97
-
98
-
99
-
100
-
101
-
102
-
103
-
104
-
105
-
106
-
107
-
108
-
109
-
110
-
111
-
112
-
113
-
114
-
115
-
116
-
117
-
118
-
119
-
120
-
121
-
122
-
 123
123 -
 124
124 -
 125
125 -
 126
126 -
 127
127 -
 128
128 -
 129
129 -
 130
130 -
 131
131 -
 132
132 -
 133
133 -
 134
134 -
 135
135 -
 136
136 -
 137
137 -
 138
138 -
 139
139 -
 140
140 -
 141
141 -
 142
142 -
 143
143 -
144
-
145
-
146
-
147
-
148
-
149
-
150
-
151
-
152
-
153
-
154
-
155
-
156
-
157
-
158
-
159
-
160
-
161
-
162
-
163
-
164
-
165
-
166
-
167
-
168
-
169
-
170
-
171
-
172
-
173
-
174
-
175
-
176
-
177
-
178
-
179
-
180
-
181
-
182
-
183
-
184
-
185
-
186
-
187
-
188
-
189
-
190
-
191
-
192
-
193
-
194
-
195
-
196
-
197
-
198
-
199
-
200
-
201
-
202
-
203
-
204
-
205
-
206
-
207
-
208
-
209
-
210
-
211
-
212
 |
 |

BP Annual Report and Accounts 2009
Notes on financial statements
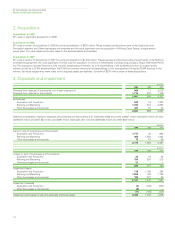
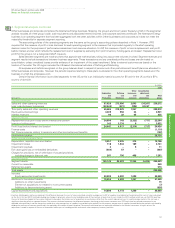
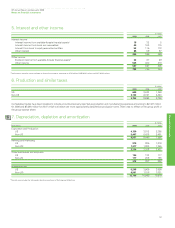
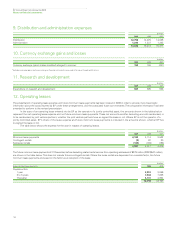
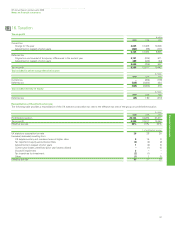
5. Interest and other income
$ million
2009 2008 2007
Interest income
Interest income from available-for-sale financial assetsa15 32 5
Interest income from loans and receivablesa69 163 175
Interest from loans to equity-accounted entities 53 115 172
Other interest 88 59 97
225 369 449
Other income
Dividend income from available-for-sale financial assetsa32 37 29
Other income 535 330 276
567 367 305
792 736 754
aTotal interest and other income related to financial instruments amounted to $116 million (2008 $232 million and 2007 $209 million).
6. Production and similar taxes
$ million
2009 2008 2007
US 649 2,602 1,260
Non-US 3,103 6,351 4,443
3,752 8,953 5,703
Comparative figures have been restated to include amounts previously reported as production and manufacturing expenses amounting to $2,427 million
for 2008 and $1,690 million for 2007 which we believe are more appropriately classified as production taxes. There was no effect on the group profit or
the group balance sheet.
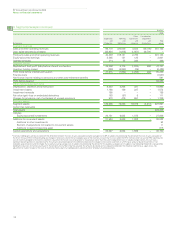
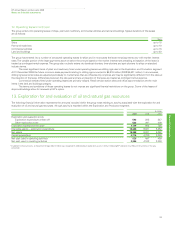
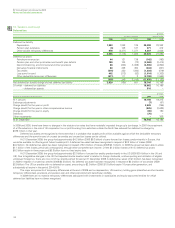
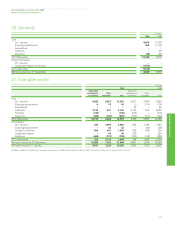
7. Depreciation, depletion and amortization
Financial statements
131
$ million
By business 2009 2008 2007
Exploration and Production
US 4,150 3,012 2,365
Non-US 5,407 5,428 5,491
9,557 8,440 7,856
Refining and Marketing
US 919 825 1,076
Non-USa1,317 1,383 1,345
2,236 2,208 2,421
Other businesses and corporate
US 136 132 117
Non-US 177 205 185
313 337 302
By geographical area
US 5,205 3,969 3,558
Non-USa6,901 7,016 7,021
12,106 10,985 10,579
aNon-US area includes the UK-based international activities of Refining and Marketing.