BP 2009 Annual Report Download - page 208
Download and view the complete annual report
Please find page 208 of the 2009 BP annual report below. You can navigate through the pages in the report by either clicking on the pages listed below, or by using the keyword search tool below to find specific information within the annual report.-
 1
1 -
2
-
3
-
4
-
5
-
6
-
7
-
8
-
9
-
10
-
11
-
12
-
13
-
14
-
15
-
16
-
17
-
18
-
19
-
20
-
21
-
22
-
23
-
24
-
25
-
26
-
27
-
28
-
29
-
30
-
31
-
32
-
33
-
34
-
35
-
36
-
37
-
38
-
39
-
40
-
41
-
42
-
43
-
44
-
45
-
46
-
47
-
48
-
49
-
50
-
51
-
52
-
53
-
54
-
55
-
56
-
57
-
58
-
59
-
60
-
61
-
62
-
63
-
64
-
65
-
66
-
67
-
68
-
69
-
70
-
71
-
72
-
73
-
74
-
75
-
76
-
77
-
78
-
79
-
80
-
81
-
82
-
83
-
84
-
85
-
86
-
87
-
88
-
89
-
90
-
91
-
92
-
93
-
94
-
95
-
96
-
97
-
98
-
99
-
100
-
101
-
102
-
103
-
104
-
105
-
106
-
107
-
108
-
109
-
110
-
111
-
112
-
113
-
114
-
115
-
116
-
117
-
118
-
119
-
120
-
121
-
122
-
123
-
124
-
125
-
126
-
127
-
128
-
129
-
130
-
131
-
132
-
133
-
134
-
135
-
136
-
137
-
138
-
139
-
140
-
141
-
142
-
143
-
144
-
145
-
146
-
147
-
148
-
149
-
150
-
151
-
152
-
153
-
154
-
155
-
156
-
157
-
158
-
159
-
160
-
161
-
162
-
163
-
164
-
165
-
166
-
167
-
168
-
169
-
170
-
171
-
172
-
173
-
174
-
175
-
176
-
177
-
178
-
179
-
180
-
181
-
182
-
183
-
184
-
185
-
186
-
187
-
188
-
189
-
190
-
191
-
192
-
193
-
194
-
195
-
196
-
197
-
 198
198 -
 199
199 -
 200
200 -
 201
201 -
 202
202 -
 203
203 -
 204
204 -
 205
205 -
 206
206 -
 207
207 -
 208
208 -
 209
209 -
 210
210 -
 211
211 -
 212
212
 |
 |

BP Annual Report and Accounts 2009
Parent company financial statements of BP p.l.c.
11. Share-based payments continued
206
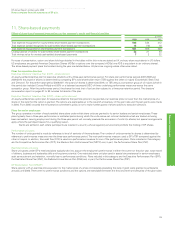
Savings and matching plans
BP ShareSave Plan
This is a savings-related share option plan under which employees save on a monthly basis, over a three-or five-year period, towards the purchase of
shares at a fixed price determined when the option is granted. This price is usually set at a 20% discount to the market price at the time of grant. The
option must be exercised within six months of maturity of the savings contract; otherwise it lapses. The plan is run in the UK and options are granted
annually, usually in June. Participants leaving for a qualifying reason have six months in which to use their savings to exercise their options on a pro-
rated basis.
BP ShareMatch Plans
These are matching share plans under which BP matches employees’ own contributions of shares up to a predetermined limit. The plans are run in the
UK and in more than 70 other countries. The UK plan is run on a monthly basis with shares being held in trust for five years before they can be released
free of any income tax and national insurance liability. In other countries the plan is run on an annual basis with shares being held in trust for three years.
The plan is operated on a cash basis in those countries where there are regulatory restrictions preventing the holding of BP shares. When the
employee leaves BP all shares must be removed from trust and units under the plan operated on a cash basis must be encashed.
Local plans
In some countries BP provides local scheme benefits, the rules and qualifications for which vary according to local circumstances.
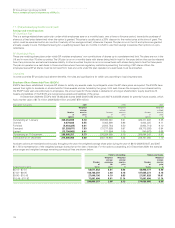
Employee Share Ownership Plans (ESOPs)
ESOPs have been established to acquire BP shares to satisfy any awards made to participants under the BP share plans as required. The ESOPs have
waived their rights to dividends on shares held for future awards and are funded by the group. Until such time as the company’s own shares held by
the ESOP trusts vest unconditionally to employees, the amount paid for those shares is deducted in arriving at shareholders’ equity (see Note 8).
Assets and liabilities of the ESOPs are recognized as assets and liabilities of the group.
At December 2009 the ESOPs held 18,062,246 shares (2008 29,051,082 shares and 2007 6,448,838 shares) for potential future awards, which
had a market value of $174 million (2008 $220 million and 2007 $79 million).
Share option transactions 2009 2008 2007
Weighted Weighted Weighted
average average average
Number exercise Number exercise Number exercise
of price of price of price
options $ options $ options $
Outstanding at 1 January 326,254,599 8.70 358,094,243 8.51 426,471,462 8.25
Granted 9,679,836 6.55 8,062,899 8.96 6,004,025 9.11
Forfeited (5,954,325) 8.81 (2,502,784) 8.50 (3,924,714) 9.10
Exercised (21,293,871) 7.53 (37,277,895) 6.97 (69,715,558) 6.94
Expired (12,790,882) 8.01 (121,864) 7.00 (740,972) 8.68
Outstanding at 31 December 295,895,357 8.73 326,254,599 8.70 358,094,243 8.51
Exercisable at 31 December 274,685,068 8.80 260,178,938 8.22 238,707,055 7.70
As share options are exercised continuously throughout the year, the weighted average share price during the year of $9.10 (2008 $10.87 and 2007
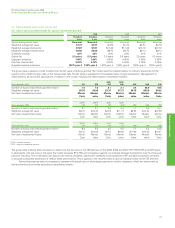
$11.72) is representative of the weighted average share price at the date of exercise. For the options outstanding at 31 December 2009, the exercise
price ranges and weighted average remaining contractual lives are shown below.
Options outstanding Options exercisable
Weighted Weighted Weighted
average average average
Number remaining exercise Number exercise
of life price of price
Range of exercise prices shares years $ shares $
$6.18 – $7.61 53,511,852 3.31 6.43 43,956,777 6.40
$7.62 – $9.05 143,736,259 2.48 8.18 137,625,273 8.16
$9.06 – $10.48 27,046,156 4.10 9.83 21,501,928 10.01
$10.49 – $11.92 71,601,090 5.81 11.14 71,601,090 11.14
295,895,357 3.58 8.73 274,685,068 8.80