BP 2009 Annual Report Download - page 25
Download and view the complete annual report
Please find page 25 of the 2009 BP annual report below. You can navigate through the pages in the report by either clicking on the pages listed below, or by using the keyword search tool below to find specific information within the annual report.-
 1
1 -
2
-
3
-
4
-
5
-
6
-
7
-
8
-
9
-
10
-
11
-
12
-
13
-
14
-
 15
15 -
 16
16 -
 17
17 -
 18
18 -
 19
19 -
 20
20 -
 21
21 -
 22
22 -
 23
23 -
 24
24 -
 25
25 -
 26
26 -
 27
27 -
 28
28 -
 29
29 -
 30
30 -
 31
31 -
 32
32 -
 33
33 -
 34
34 -
 35
35 -
36
-
37
-
38
-
39
-
40
-
41
-
42
-
43
-
44
-
45
-
46
-
47
-
48
-
49
-
50
-
51
-
52
-
53
-
54
-
55
-
56
-
57
-
58
-
59
-
60
-
61
-
62
-
63
-
64
-
65
-
66
-
67
-
68
-
69
-
70
-
71
-
72
-
73
-
74
-
75
-
76
-
77
-
78
-
79
-
80
-
81
-
82
-
83
-
84
-
85
-
86
-
87
-
88
-
89
-
90
-
91
-
92
-
93
-
94
-
95
-
96
-
97
-
98
-
99
-
100
-
101
-
102
-
103
-
104
-
105
-
106
-
107
-
108
-
109
-
110
-
111
-
112
-
113
-
114
-
115
-
116
-
117
-
118
-
119
-
120
-
121
-
122
-
123
-
124
-
125
-
126
-
127
-
128
-
129
-
130
-
131
-
132
-
133
-
134
-
135
-
136
-
137
-
138
-
139
-
140
-
141
-
142
-
143
-
144
-
145
-
146
-
147
-
148
-
149
-
150
-
151
-
152
-
153
-
154
-
155
-
156
-
157
-
158
-
159
-
160
-
161
-
162
-
163
-
164
-
165
-
166
-
167
-
168
-
169
-
170
-
171
-
172
-
173
-
174
-
175
-
176
-
177
-
178
-
179
-
180
-
181
-
182
-
183
-
184
-
185
-
186
-
187
-
188
-
189
-
190
-
191
-
192
-
193
-
194
-
195
-
196
-
197
-
198
-
199
-
200
-
201
-
202
-
203
-
204
-
205
-
206
-
207
-
208
-
209
-
210
-
211
-
212
 |
 |

t
A
BP Annual Report and Accounts 2009
Business review
Business review
Business review
We continually seek to access resources and in 2009 this included Iraq,
where, together with China National Petroleum Corporation (CNPC), we
entered into a contract with the state-owned South Oil Company (SOC)
to expand production from the Rumaila field; Jordan, where on 3 January
2010, we received approval from the Government of Jordan to join the
state-owned National Petroleum Company (NPC) to exploit the onshore
Risha concession in the north east of the country; further access in
Egypt, where we were awarded two blocks in an offshore area of the
Nile Delta; Indonesia, where we signed a production-sharing agreement
(PSA) for the exploration and development of coalbed methane in the
Sanga-Sanga block, supplying gas to Indonesia’s largest LNG export
facility and, subject to Government of Indonesia approval, farmed into
Chevron’s West Papua I & III blocks; and the Gulf of Mexico, where we
were awarded 61 blocks through the Outer Continental Shelf Lease Sales
208 and 210.
In 2009, we were involved in a number of discoveries. The most
significant of these were in the deepwater Gulf of Mexico with the Tiber
well; Angola, where we made three further discoveries in the ultra
deepwater Block 31; and Canada, where we discovered natural gas with
the Ellice J27 well.
Seven major projects came onstream. We continue to grow our
position and leverage our experience as the largest producer in the Gulf
of Mexico, starting up three projects ahead of schedule, including the
second phase of Atlantis. In addition, production commenced at our
Savonette field in Trinidad, at our Tangguh LNG project in Indonesia and,
through TNK-BP, we saw the start-up of a further two projects, in the
northern hub of Kamennoye, and the Urna and Ust-Tegus fields in the
Uvat area.
Production from our established centres – including the North
Sea, Alaska, North America Gas and Trinidad – was on plan, with
improved operating efficiency for the segment as a whole, and we had
strong production growth in the Gulf of Mexico, including excellent
performance from Thunder Horse. Production from Egypt and TNK-BP
also made a strong contribution to our growth.
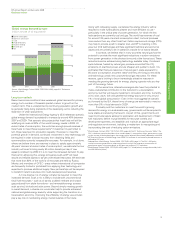
Production for the year was up more than 4% from last year. After
adjusting for the effect of entitlement changes in our PSAs and the effect
of OPEC quota restrictions, underlying production growthawas 5%
higher than 2008.
aUnderlying production growth excludes the effect of entitlement changes in our PSAs (driven by
changes in oil and gas prices) and the effect of OPEC quota restrictions.
We also reduced unit production costs through a combination of high-
grading activity, improving execution efficiency, capturing the benefits
of the deflationary cost environment at the beginning of the year and
favourable foreign exchange effects. During 2009 we improved the
quality of our procurement and supply chain management organization,
systems and processes, which we expect will help deliver sustained cos
efficiency in the future.
The replacement cost profit before interest and tax was
$24.8 billion, a 35% decrease compared with the record level in 2008.
This result was primarily driven by lower oil and gas realizations, lower
income from equity-accounted entities and higher depreciation, partly
offset by strong underlying production growth and improved cost
management, which contributed to a 12% reduction in unit production
costs. Our financial results are discussed in more detail on pages 55-56.
Total capital expenditure including acquisitions and asset
exchanges in 2009 was $14.9 billion (2008 $22.2 billion and 2007
$14.2 billion). In 2009, capital expenditure included $306 million relating
to the award of the contract to redevelop the Rumaila field in Iraq.
Development expenditure of subsidiaries incurred in 2009,
excluding midstream activities, was $10,396 million, compared with
$11,767 million in 2008 and $10,153 million in 2007.
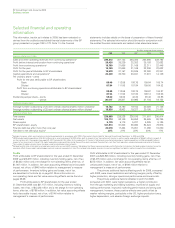
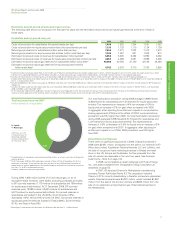
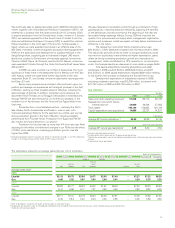
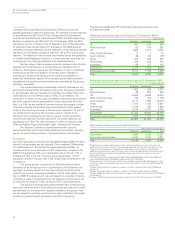
Key statistics
$ million
2009 2008 2007
Sales and other operating revenuesa57,626 86,170 65,740
Replacement cost profit before
interest and taxb24,800 38,308 27,602
Total assets 140,149 136,665 125,736
Capital expenditure and acquisitions 14,896 22,227 14,207
$ per barrel
Average BP liquids realizationsc d 56.26 90.20 67.45
$ per thousand cubic feet
verage BP natural gas realizationsc3.25 6.00 4.53
aIncludes sales between businesses.
bIncludes profit after interest and tax of equity-accounted entities.
cRealizations are based on sales of consolidated subsidiaries only, which excludes equity-accounted
entities.
dCrude oil and natural gas liquids.
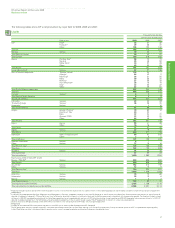
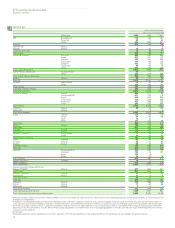
The table below presents our average sales price per unit of production.
$ per unit of productiona
Europe North South Africa Asia Australasia Total group
America America average
Rest of
Rest of North Rest of
UK Europe US America Russia Asia
Average sales priceb
2009
Liquidsc62.19 60.73 53.68 30.77 52.48 57.40 – 61.27 57.22 56.26
Gas 4.68 7.62 3.07 3.53 2.50 3.61 – 3.30 5.25 3.25
2008
Liquidsc89.82 93.77 89.22 64.42 91.61 89.44 – 97.20 86.33 90.20
Gas 8.41 6.96 6.77 7.87 4.90 4.46 – 3.63 9.22 6.00
2007
Liquidsc69.17 70.41 64.18 48.24 65.54 67.81 – 73.00 70.56 67.45
Gas 6.40 5.84 5.43 6.24 3.25 3.93 – 3.05 5.96 4.53
aUnits of production are barrels for liquids and thousands of cubic feet for gas.
bRealizations are based on sales of consolidated subsidiaries only (including transfers between businesses), which excludes equity-accounted entities.
cCrude oil and natural gas liquids.
23