BP 2009 Annual Report Download - page 132
Download and view the complete annual report
Please find page 132 of the 2009 BP annual report below. You can navigate through the pages in the report by either clicking on the pages listed below, or by using the keyword search tool below to find specific information within the annual report.-
 1
1 -
2
-
3
-
4
-
5
-
6
-
7
-
8
-
9
-
10
-
11
-
12
-
13
-
14
-
15
-
16
-
17
-
18
-
19
-
20
-
21
-
22
-
23
-
24
-
25
-
26
-
27
-
28
-
29
-
30
-
31
-
32
-
33
-
34
-
35
-
36
-
37
-
38
-
39
-
40
-
41
-
42
-
43
-
44
-
45
-
46
-
47
-
48
-
49
-
50
-
51
-
52
-
53
-
54
-
55
-
56
-
57
-
58
-
59
-
60
-
61
-
62
-
63
-
64
-
65
-
66
-
67
-
68
-
69
-
70
-
71
-
72
-
73
-
74
-
75
-
76
-
77
-
78
-
79
-
80
-
81
-
82
-
83
-
84
-
85
-
86
-
87
-
88
-
89
-
90
-
91
-
92
-
93
-
94
-
95
-
96
-
97
-
98
-
99
-
100
-
101
-
102
-
103
-
104
-
105
-
106
-
107
-
108
-
109
-
110
-
111
-
112
-
113
-
114
-
115
-
116
-
117
-
118
-
119
-
120
-
121
-
 122
122 -
 123
123 -
 124
124 -
 125
125 -
 126
126 -
 127
127 -
 128
128 -
 129
129 -
 130
130 -
 131
131 -
 132
132 -
 133
133 -
 134
134 -
 135
135 -
 136
136 -
 137
137 -
 138
138 -
 139
139 -
 140
140 -
 141
141 -
 142
142 -
143
-
144
-
145
-
146
-
147
-
148
-
149
-
150
-
151
-
152
-
153
-
154
-
155
-
156
-
157
-
158
-
159
-
160
-
161
-
162
-
163
-
164
-
165
-
166
-
167
-
168
-
169
-
170
-
171
-
172
-
173
-
174
-
175
-
176
-
177
-
178
-
179
-
180
-
181
-
182
-
183
-
184
-
185
-
186
-
187
-
188
-
189
-
190
-
191
-
192
-
193
-
194
-
195
-
196
-
197
-
198
-
199
-
200
-
201
-
202
-
203
-
204
-
205
-
206
-
207
-
208
-
209
-
210
-
211
-
212
 |
 |

b
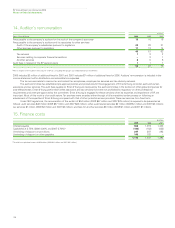
BP Annual Report and Accounts 2009
Notes on financial statements
130
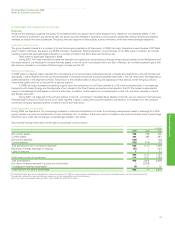
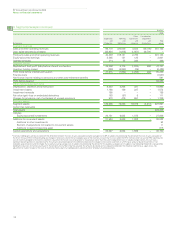
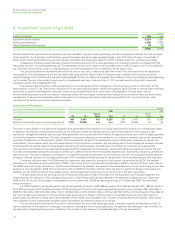
4. Segmental analysis continued
$ million
2009
By geographical area US Non-US Total
Revenues
Third party sales and other operating revenuesa83,982 155,290 239,272
Results
Replacement cost profit before interest and taxation 2,806 19,698 22,504
Non-current assets
Other non-current assetsbc 64,529 93,580 158,109
Other investments 1,567
Loans 1,039
Other receivables 1,729
Derivative financial instruments 3,965
Deferred tax assets 516
Defined benefit pension plan surpluses 1,390
Total non-current assets 168,315
Capital expenditure and acquisitions 9,865 10,444 20,309
aNon-US region includes UK $51,172 million.
Non-US region includes UK $16,713 million.
cExcluding financial instruments, deferred tax assets and post-employment benefit plan surpluses.
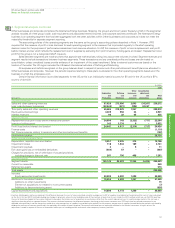
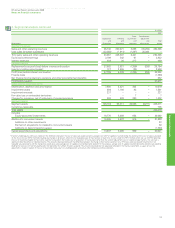
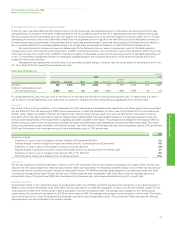
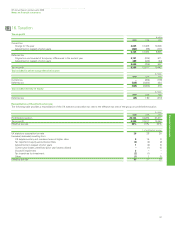
$ million
2008
By geographical area US Non-US Total
Revenues
Third party sales and other operating revenuesa123,364 237,779 361,143
Results
Replacement cost profit before interest and taxation 10,678 31,049 41,727
Non-current assets
Other non-current assetsbc 62,679 89,823 152,502
Other investments 855
Loans 995
Other receivables 710
Derivative financial instruments 5,054
Defined benefit pension plan surpluses 1,738
Total non-current assets 161,854
Capital expenditure and acquisitions 16,046 14,654 30,700
aNon-US region includes UK $81,773 million.
bNon-US region includes UK $15,990 million.
cExcluding financial instruments, and post-employment benefit plan surpluses.
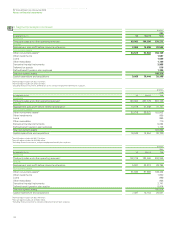
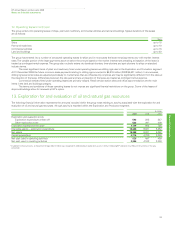
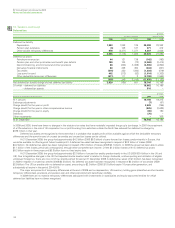
$ million
2007
By geographical area US Non-US Total
Revenues
Third party sales and other operating revenuesa102,319 182,046 284,365
Results
Replacement cost profit before interest and taxation 5,581 23,213 28,794
Non-current assets
Other non-current assetsbc 51,840 87,582 139,422
Other investments 1,830
Loans 999
Other receivables 968
Derivative financial instruments 3,741
Defined benefit pension plan surplus 8,914
Total non-current assets 155,874
Capital expenditure and acquisitions 7,487 13,154 20,641
aNon-US region includes UK $61,149 million.
bNon-US region includes UK $19,302 million.
cExcluding financial instruments and post-employment benefit plan surpluses.