BP 2009 Annual Report Download - page 189
Download and view the complete annual report
Please find page 189 of the 2009 BP annual report below. You can navigate through the pages in the report by either clicking on the pages listed below, or by using the keyword search tool below to find specific information within the annual report.-
 1
1 -
2
-
3
-
4
-
5
-
6
-
7
-
8
-
9
-
10
-
11
-
12
-
13
-
14
-
15
-
16
-
17
-
18
-
19
-
20
-
21
-
22
-
23
-
24
-
25
-
26
-
27
-
28
-
29
-
30
-
31
-
32
-
33
-
34
-
35
-
36
-
37
-
38
-
39
-
40
-
41
-
42
-
43
-
44
-
45
-
46
-
47
-
48
-
49
-
50
-
51
-
52
-
53
-
54
-
55
-
56
-
57
-
58
-
59
-
60
-
61
-
62
-
63
-
64
-
65
-
66
-
67
-
68
-
69
-
70
-
71
-
72
-
73
-
74
-
75
-
76
-
77
-
78
-
79
-
80
-
81
-
82
-
83
-
84
-
85
-
86
-
87
-
88
-
89
-
90
-
91
-
92
-
93
-
94
-
95
-
96
-
97
-
98
-
99
-
100
-
101
-
102
-
103
-
104
-
105
-
106
-
107
-
108
-
109
-
110
-
111
-
112
-
113
-
114
-
115
-
116
-
117
-
118
-
119
-
120
-
121
-
122
-
123
-
124
-
125
-
126
-
127
-
128
-
129
-
130
-
131
-
132
-
133
-
134
-
135
-
136
-
137
-
138
-
139
-
140
-
141
-
142
-
143
-
144
-
145
-
146
-
147
-
148
-
149
-
150
-
151
-
152
-
153
-
154
-
155
-
156
-
157
-
158
-
159
-
160
-
161
-
162
-
163
-
164
-
165
-
166
-
167
-
168
-
169
-
170
-
171
-
172
-
173
-
174
-
175
-
176
-
177
-
178
-
 179
179 -
 180
180 -
 181
181 -
 182
182 -
 183
183 -
 184
184 -
 185
185 -
 186
186 -
 187
187 -
 188
188 -
 189
189 -
 190
190 -
 191
191 -
 192
192 -
 193
193 -
 194
194 -
 195
195 -
 196
196 -
 197
197 -
 198
198 -
 199
199 -
200
-
201
-
202
-
203
-
204
-
205
-
206
-
207
-
208
-
209
-
210
-
211
-
212
 |
 |

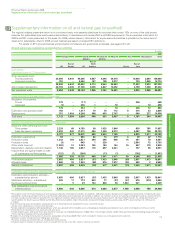
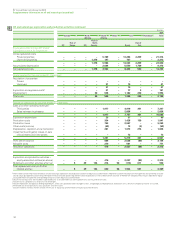
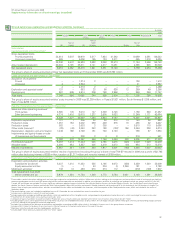
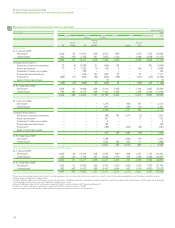
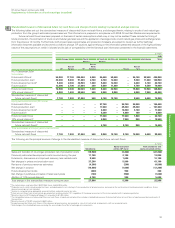
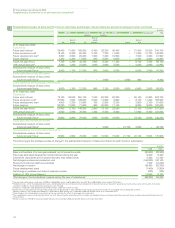
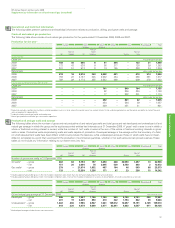
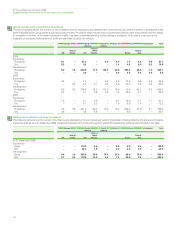
Movements in estimated net proved reserves continued
33
60
16
187
BP Annual Report and Accounts 2009
Supplementary information on oil and natural gas (unaudited)
Financial statements
million barrels
Crude oila2007
Europe North South Africa Asia Australasia Total
America America
Rest of
Rest of North Rest of
UK Europe USfAmerica Russia Asia
Subsidiaries
At 1 January 2007
Developed 458 189 1,916 15 115 193 – 104 51 3,041
Undeveloped 146 97 1,292 2 235 512 – 487 81 2,852
604 286 3,208 17 350 705 – 591 132 5,893
Changes attributable to
Revisions of previous estimates (1) (25) 18 – (29) (133) – (29) (5) (204)
Improved recovery 7 1 99 – 6 12 – 6 – 131
Purchases of reserves-in-place – – 25 ––––8 –
Discoveries and extensions – 31 60 – 1 93 – – 2 187
Productionb(73) (19) (169) (3) (24) (71) – (83) (12) (454)
Sales of reserves-in-place – – (94) ––––––(94)
(67) (12) (61) (3) (46) (99) – (98) (15) (401)
At 31 December 2007c
Developed 414 105 1,882 13 102 256 – 121 44 2,937
Undeveloped 123 169 1,265 1 202 350 – 372 73 2,555
537 274 3,147 14 304 606 – 493 117 5,492
Equity-accounted entities (BP share)dg
At 1 January 2007
Developed ––––221 – 2,200 521 – 2,942
Undeveloped ––––139 – 644 163 – 946
––––360 – 2,844 684 – 3,888
Changes attributable to
Revisions of previous estimates ––––178 – 413 167 – 758
Improved recovery ––––59 ––1 –
Purchases of reserves-in-place ––––––16 ––
Discoveries and extensions ––––2 –283 – – 285
Production ––––(28) – (304) (73) – (405)
Sales of reserves-in-place ––––––(21) – – (21)
––––211 – 387 95 – 693
At 31 December 2007e
Developed ––––328 – 2,094 574 – 2,996
Undeveloped ––––243 – 1,137 205 – 1,585
––––571 – 3,231 779 – 4,581
Total subsidiaries and equity-accounted entities (BP share)
At 1 January 2007
Developed 458 189 1,916 15 336 193 2,200 625 51 5,983
Undeveloped 146 97 1,292 2 374 512 644 650 81 3,798
604 286 3,208 17 710 705 2,844 1,275 132 9,781
At 31 December 2007
Developed 414 105 1,882 13 430 256 2,094 695 44 5,933
Undeveloped 123 169 1,265 1 445 350 1,137 577 73 4,140
537 274 3,147 14 875 606 3,231 1,272 117 10,073
aCrude oil includes NGLs and condensate. Proved reserves exclude royalties due to others, whether payable in cash or in kind, where the royalty owner has a direct interest in the underlying
production and the option and ability to make lifting and sales arrangements independently.
bExcludes NGLs from processing plants in which an interest is held of 54 thousand barrels a day.
cIncludes 739 million barrels of NGLs. Also includes 20 million barrels of crude oil in respect of the 30% minority interest in BP Trinidad and Tobago LLC.
dThe BP group holds interests, through associates, in onshore and offshore concessions in Abu Dhabi, expiring in 2014 and 2018 respectively. During the second quarter of 2007, we updated our
reporting policy in Abu Dhabi to be consistent with general industry practice and as a result have started reporting production and reserves there gross of production taxes. This change resulted in an
increase in our reserves of 153 million barrels and in our production of 33mb/d.
eIncludes 26 million barrels of NGLs. Also includes 210 million barrels of crude oil in respect of the 6.51% minority interest in TNK-BP.
fProved reserves in the Prudhoe Bay field in Alaska include an estimated 98 million barrels upon which a net profits royalty will be payable over the life of the field under the terms of the BP Prudhoe
Bay Royalty Trust.
gVolumes of equity-accounted entities include volumes of equity-accounted investments of those entities.