BP 2009 Annual Report Download - page 29
Download and view the complete annual report
Please find page 29 of the 2009 BP annual report below. You can navigate through the pages in the report by either clicking on the pages listed below, or by using the keyword search tool below to find specific information within the annual report.-
 1
1 -
2
-
3
-
4
-
5
-
6
-
7
-
8
-
9
-
10
-
11
-
12
-
13
-
14
-
15
-
16
-
17
-
18
-
 19
19 -
 20
20 -
 21
21 -
 22
22 -
 23
23 -
 24
24 -
 25
25 -
 26
26 -
 27
27 -
 28
28 -
 29
29 -
 30
30 -
 31
31 -
 32
32 -
 33
33 -
 34
34 -
 35
35 -
 36
36 -
 37
37 -
 38
38 -
 39
39 -
40
-
41
-
42
-
43
-
44
-
45
-
46
-
47
-
48
-
49
-
50
-
51
-
52
-
53
-
54
-
55
-
56
-
57
-
58
-
59
-
60
-
61
-
62
-
63
-
64
-
65
-
66
-
67
-
68
-
69
-
70
-
71
-
72
-
73
-
74
-
75
-
76
-
77
-
78
-
79
-
80
-
81
-
82
-
83
-
84
-
85
-
86
-
87
-
88
-
89
-
90
-
91
-
92
-
93
-
94
-
95
-
96
-
97
-
98
-
99
-
100
-
101
-
102
-
103
-
104
-
105
-
106
-
107
-
108
-
109
-
110
-
111
-
112
-
113
-
114
-
115
-
116
-
117
-
118
-
119
-
120
-
121
-
122
-
123
-
124
-
125
-
126
-
127
-
128
-
129
-
130
-
131
-
132
-
133
-
134
-
135
-
136
-
137
-
138
-
139
-
140
-
141
-
142
-
143
-
144
-
145
-
146
-
147
-
148
-
149
-
150
-
151
-
152
-
153
-
154
-
155
-
156
-
157
-
158
-
159
-
160
-
161
-
162
-
163
-
164
-
165
-
166
-
167
-
168
-
169
-
170
-
171
-
172
-
173
-
174
-
175
-
176
-
177
-
178
-
179
-
180
-
181
-
182
-
183
-
184
-
185
-
186
-
187
-
188
-
189
-
190
-
191
-
192
-
193
-
194
-
195
-
196
-
197
-
198
-
199
-
200
-
201
-
202
-
203
-
204
-
205
-
206
-
207
-
208
-
209
-
210
-
211
-
212
 |
 |

BP Annual Report and Accounts 2009
Business review
Business review
Business review
8
8
16
5
7
2
27
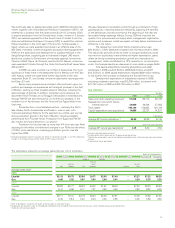
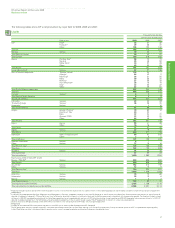
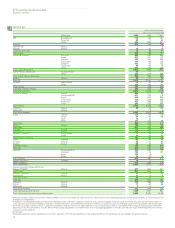
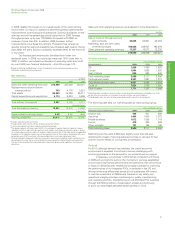
The following tables show BP’s net production by major field for 2009, 2008 and 2007.
Liquids
thousand barrels per day
BP net share of productiona
Field or area 2009 2008 2007
UKbETAPc34 27 32
Foinavend29 26 37
Other 105 120 132
Total UK 168 173 201
Norway Various 40 43 51
Total Rest of Europe 40 43 51
Total Europe 208 216 252
Alaska Prudhoe Bayd69 72 74
Kuparuk 45 48 52
Milne Pointd24 27 28
Other 43 50 55
Total Alaska 181 197 209
Lower 48 onshorebVarious 97 97 108
Gulf of Mexico deepwater Thunder Horsed133 24 –
Atlantisd54 42 2
Mad Dogd35 31 25
Mars 29 28 30
Na Kikad27 29 32
Horn Mountaind25 18 18
Kingd22 23 22
Other 62 49 67
Total Gulf of Mexico deepwater 387 244 196
Total US 665 538 513
CanadabVariousd89
Total Rest of North America 89
Total North America 673 547 521
Colombia Variousd23 24 28
Trinidad & Tobago Variousd38 38 30
VenezuelabVarious –4
Total South America 61 66 74
Angola Greater Plutoniod70 69 12
Kizomba C Dev 43 30 –
Dalia 32 34 31
Girassol FPSO 22 22 20
Other 44 46 77
Total Angola 211 201 140
Egypt Gupco 55 41 36
Other 16 16 7
Total Egypt 71 57 43
Algeria Various 22 19 12
Total Africa 304 277 195
Azerbaijan Azeri-Chirag-Gunashlid94 97 200
Other 78
Total Azerbaijan 101 105 205
Western IndonesiabVarious 57
Other Various 17 16 16
Total Rest of Asiab123 128 228
Total Asia 123 128 228
Australia Various 31 29 34
Total Australasia 31 29 34
Total subsidiariese1,400 1,263 1,304
Equity-accounted entities (BP share)
Russia – TNK-BPbVarious 840 826 832
Total Russia 840 826 832
Abu DhabifVarious 182 210 192
Other Various 12 10 9
Total Rest of Asiab194 220 201
Total Asia 1,034 1,046 1,033
Argentina Various 75 70 69
VenezuelabVarious 25 19 6
BoliviabVarious 13
Total South America 101 92 77
Total equity-accounted entities 1,135 1,138 1,110
Total subsidiaries and equity-accounted entities 2,535 2,401 2,414
aProduction excludes royalties due to others whether payable in cash or in kind where the royalty owner has a direct interest in the underlying production and the option and ability to make lifting and sales arrangements
independently.
bIn 2009, BP assumed operatorship of the Mirpurkhas and Khipro blocks in Pakistan, swapped a number of assets with BG Group plc in the UK sector of the North Sea, divested some minor interests in the US Lower 48,
divested its holdings in Indonesia’s Offshore Northwest Java to Pertamina, divested its interests in LukArco to Lukoil and the Bolivian government nationalized, with compensation payable, Pan American Energy’s shares
of Chaco. In 2008, BP concluded the migration of the Cerro Negro operations to an incorporated joint venture with PDVSA while retaining its equity position and TNK-BP disposed of some non-core interests. In 2007, BP
divested its producing properties in the Netherlands and some producing properties in the US Lower 48 and Canada. TNK-BP disposed of its interests in several non-core properties.
cVolumes relate to six BP-operated fields within ETAP. BP has no interests in the remaining three ETAP fields, which are operated by Shell.
dBP-operated.
eIncludes 26 net mboe/d of NGLs from processing plants in which BP has an interest (2008 19mboe/d and 2007 54mboe/d).
fThe BP group holds interests, through associates, in onshore and offshore concessions in Abu Dhabi, expiring in 2014 and 2018 respectively. During the second quarter of 2007, we updated our reporting policy
in Abu Dhabi to be consistent with general industry practice and as a result we report production and reserves there gross of production taxes.