BP 2009 Annual Report Download - page 64
Download and view the complete annual report
Please find page 64 of the 2009 BP annual report below. You can navigate through the pages in the report by either clicking on the pages listed below, or by using the keyword search tool below to find specific information within the annual report.-
 1
1 -
2
-
3
-
4
-
5
-
6
-
7
-
8
-
9
-
10
-
11
-
12
-
13
-
14
-
15
-
16
-
17
-
18
-
19
-
20
-
21
-
22
-
23
-
24
-
25
-
26
-
27
-
28
-
29
-
30
-
31
-
32
-
33
-
34
-
35
-
36
-
37
-
38
-
39
-
40
-
41
-
42
-
43
-
44
-
45
-
46
-
47
-
48
-
49
-
50
-
51
-
52
-
53
-
 54
54 -
 55
55 -
 56
56 -
 57
57 -
 58
58 -
 59
59 -
 60
60 -
 61
61 -
 62
62 -
 63
63 -
 64
64 -
 65
65 -
 66
66 -
 67
67 -
 68
68 -
 69
69 -
 70
70 -
 71
71 -
 72
72 -
 73
73 -
 74
74 -
75
-
76
-
77
-
78
-
79
-
80
-
81
-
82
-
83
-
84
-
85
-
86
-
87
-
88
-
89
-
90
-
91
-
92
-
93
-
94
-
95
-
96
-
97
-
98
-
99
-
100
-
101
-
102
-
103
-
104
-
105
-
106
-
107
-
108
-
109
-
110
-
111
-
112
-
113
-
114
-
115
-
116
-
117
-
118
-
119
-
120
-
121
-
122
-
123
-
124
-
125
-
126
-
127
-
128
-
129
-
130
-
131
-
132
-
133
-
134
-
135
-
136
-
137
-
138
-
139
-
140
-
141
-
142
-
143
-
144
-
145
-
146
-
147
-
148
-
149
-
150
-
151
-
152
-
153
-
154
-
155
-
156
-
157
-
158
-
159
-
160
-
161
-
162
-
163
-
164
-
165
-
166
-
167
-
168
-
169
-
170
-
171
-
172
-
173
-
174
-
175
-
176
-
177
-
178
-
179
-
180
-
181
-
182
-
183
-
184
-
185
-
186
-
187
-
188
-
189
-
190
-
191
-
192
-
193
-
194
-
195
-
196
-
197
-
198
-
199
-
200
-
201
-
202
-
203
-
204
-
205
-
206
-
207
-
208
-
209
-
210
-
211
-
212
 |
 |

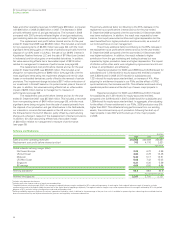
62
BP Annual Report and Accounts 2009
Business review
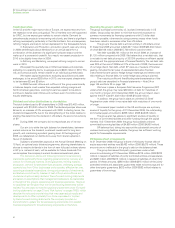
Trend information
In the US and the major economies of Europe, we expect recovery from
the recession to be slow and gradual. The oil markets look well supported
by OPEC, but we expect gas markets to remain volatile. Demand for
petrochemicals products is recovering only slowly, and there is significant
refining over-capacity particularly in the Atlantic Basin. As a consequence,
refining margins are likely to remain depressed for the foreseeable future.
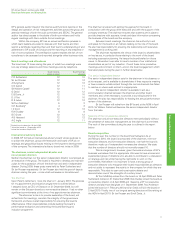
In Exploration and Production, production growth was very strong
in 2009, benefiting by about 40mboe/d on an annual basis from a
combination of the absence of a significant hurricane season and the
make-up of a prior-period underlift. As a result, we expect production in
2010 to be slightly lower than in 2009.
In Refining and Marketing, we expect refining margins to remain
weak in 2010.
We expect the quarterly loss in Other businesses and corporate,
excluding non-operating items, to average around $400 million in 2010. This
will, as in previous years, remain volatile on an individual quarterly basis.
We expect capital expenditure, excluding acquisitions and asset
exchanges, to be around $20 billion in 2010, and we expect divestments
to be between $2 and $3 billion.
In 2009 the cash inflows and outflows of the group were broadly
in balance despite much weaker than expected refining margins and
North American gas prices. Looking forward we expect to be able to
continue to balance cash inflows and outflows even if conditions are
equally challenging.
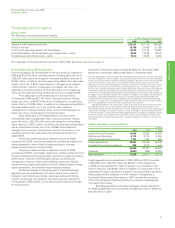
Dividends and other distributions to shareholders
The total dividend paid to BP shareholders in 2009 was $10,483 million,
compared with $10,342 million for 2008. The dividend paid per share was
56 cents, an increase of 2% compared with 2008. In sterling terms, the
dividend increased 24% due to the strengthening of the dollar relative to
sterling. We determine the dividend in US dollars, the economic currency
of BP.
During 2009, the company did not repurchase any of its own
shares.
Our aim is to strike the right balance for shareholders, between
current returns via the dividend, sustained investment for long-term
growth, and maintaining a prudent gearing level. At the beginning of
2008, we rebalanced our distributions away from share buybacks in
favour of dividends.
Subject to shareholder approval at the Annual General Meeting on
15 April, an optional scrip dividend programme, allowing shareholders to
choose to receive dividends in the form of new fully paid ordinary shares
in BP p.l.c. instead of cash, will be available for future dividends. This
would replace the company’s current dividend reinvestment plans.
The discussion above and following contains forward-looking
statements particularly those regarding global economic recovery and
outlook for oil and gas markets, oil and gas prices, refining margins,
production, demand for petrochemicals products, underlying average
quarterly loss from Other businesses and corporate, effective tax rate,
operating and capital expenditure, timing and proceeds of divestments,
contractual commitments, balance of cash inflows and outflows and
dividend and optional scrip dividend. These forward-looking statements
are based on assumptions that management believes to be reasonable
in the light of the group’s operational and financial experience. However,
no assurance can be given that the forward-looking statements will be
realized. You are urged to read the cautionary statement under ‘Forward-
looking statements’ on page 21 and ‘Risk factors’ on pages 18-20, which
describe the risks and uncertainties that may cause actual results and
developments to differ materially from those expressed or implied
by these forward-looking statements. The company provides no
commitment to update the forward-looking statements or to publish
financial projections for forward-looking statements in the future.
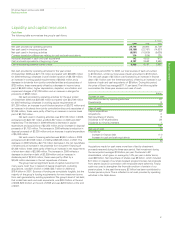
Financing the group’s activities
The group’s principal commodity, oil, is priced internationally in US
dollars. Group policy has been to minimize economic exposure to
currency movements by financing operations with US dollar debt
wherever possible, otherwise by using currency swaps when funds
have been raised in currencies other than US dollars.
The group’s finance debt is almost entirely in US dollars and at
31 December 2009 amounted to $34,627 million (2008 $33,204 million)
of which $9,109 million (2008 $15,740 million) was short term.
Net debt was $26,161 million at the end of 2009, an increase of
$1,120 million compared with 2008. We believe that a net debt ratio, that
is net debt to net debt plus equity, of 20-30% provides an efficient capital
structure and the appropriate level of financial flexibility. The net debt ratio
was 20% at the end of 2009 and 21% at the end of 2008, the lower end
of our target band. Net debt, which BP uses as a measure of financial
gearing, includes the fair value of associated derivative financial
instruments that are used to hedge foreign exchange and interest rate
risks relating to finance debt, for which hedge accounting is claimed.
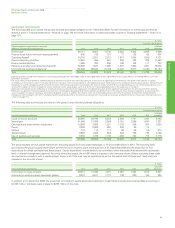
The maturity profile and fixed/floating rate characteristics of the
group’s debt are described in Financial statements – Note 24 on
page 144 and Note 32 on page 158.
We have in place a European Debt Issuance Programme (DIP)
under which the group may raise $20 billion of debt for maturities of
one month or longer. At 31 December 2009, the amount drawn down
against the DIP was $11,403 million (2008 $10,334 million).
In addition, the group has in place an unlimited US Shelf
Registration under which it may raise debt with maturities of one month
or longer.
Commercial paper markets in the US and Europe are a primary
source of liquidity for the group. At 31 December 2009, the outstanding
commercial paper amounted to $398 million (2008 $4,268 million).
The group also has access to significant sources of liquidity in
the form of committed facilities and other funding through the capital
markets. At 31 December 2009, the group had available undrawn
committed borrowing facilities of $4,950 million (2008 $4,950 million).
BP believes that, taking into account the substantial amounts of
undrawn borrowing facilities available, the group has sufficient working
capital for foreseeable requirements.
Off-balance sheet arrangements
At 31 December 2009, the group’s share of third-party finance debt of
equity-accounted entities was $6,483 million (2008 $6,675 million). These
amounts are not reflected in the group’s debt on the balance sheet.
The group has issued third-party guarantees under which
amounts outstanding at 31 December 2009 are $319 million (2008 $223
million) in respect of liabilities of jointly controlled entities and associates
and $667 million (2008 $613 million) in respect of liabilities of other third
parties. Of these amounts, $286 million (2008 $215 million) of the jointly
controlled entities and associates guarantees relate to borrowings and for
other third-party guarantees, $633 million (2008 $582 million) relates to
guarantees of borrowings.