BP 2009 Annual Report Download - page 11
Download and view the complete annual report
Please find page 11 of the 2009 BP annual report below. You can navigate through the pages in the report by either clicking on the pages listed below, or by using the keyword search tool below to find specific information within the annual report.-
 1
1 -
 2
2 -
 3
3 -
 4
4 -
 5
5 -
 6
6 -
 7
7 -
 8
8 -
 9
9 -
 10
10 -
 11
11 -
 12
12 -
 13
13 -
 14
14 -
 15
15 -
 16
16 -
 17
17 -
 18
18 -
 19
19 -
 20
20 -
 21
21 -
 22
22 -
23
-
24
-
25
-
26
-
27
-
28
-
29
-
30
-
31
-
32
-
33
-
34
-
35
-
36
-
37
-
38
-
39
-
40
-
41
-
42
-
43
-
44
-
45
-
46
-
47
-
48
-
49
-
50
-
51
-
52
-
53
-
54
-
55
-
56
-
57
-
58
-
59
-
60
-
61
-
62
-
63
-
64
-
65
-
66
-
67
-
68
-
69
-
70
-
71
-
72
-
73
-
74
-
75
-
76
-
77
-
78
-
79
-
80
-
81
-
82
-
83
-
84
-
85
-
86
-
87
-
88
-
89
-
90
-
91
-
92
-
93
-
94
-
95
-
96
-
97
-
98
-
99
-
100
-
101
-
102
-
103
-
104
-
105
-
106
-
107
-
108
-
109
-
110
-
111
-
112
-
113
-
114
-
115
-
116
-
117
-
118
-
119
-
120
-
121
-
122
-
123
-
124
-
125
-
126
-
127
-
128
-
129
-
130
-
131
-
132
-
133
-
134
-
135
-
136
-
137
-
138
-
139
-
140
-
141
-
142
-
143
-
144
-
145
-
146
-
147
-
148
-
149
-
150
-
151
-
152
-
153
-
154
-
155
-
156
-
157
-
158
-
159
-
160
-
161
-
162
-
163
-
164
-
165
-
166
-
167
-
168
-
169
-
170
-
171
-
172
-
173
-
174
-
175
-
176
-
177
-
178
-
179
-
180
-
181
-
182
-
183
-
184
-
185
-
186
-
187
-
188
-
189
-
190
-
191
-
192
-
193
-
194
-
195
-
196
-
197
-
198
-
199
-
200
-
201
-
202
-
203
-
204
-
205
-
206
-
207
-
208
-
209
-
210
-
211
-
212
 |
 |

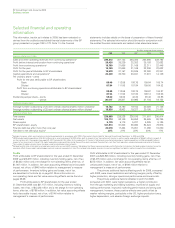
Business review
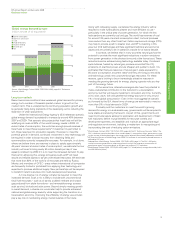
Performance
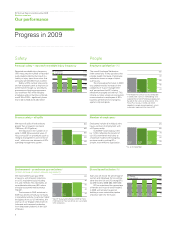
Production (thousand barrels of oil equivalent per day)
We report crude oil, natural gas liquids
(NGLs) and natural gas produced from
subsidiaries and equity-accounted
entities. These are converted to barrels
of oil equivalent (boe) at 1 barrel of
NGL = 1boe and 5,800 standard
cubic feet of natural gas = 1boe.
Reported production increased
by 4% compared with 2008. This
refl ected strong performance from
our existing assets, the continued
ramp-up of production following the
start-up of major projects in 2008 and
the start-up of a further seven major
projects in 2009.
4,250
4,000
3,750
3,500
3,818
2007
3,838
2008
3,998
2009
3,250
Reserves replacement ratioa b (%)
Proved reserves replacement ratio (also
known as the production replacement
ratio) is the extent to which production
is replaced by proved reserves additions.
The ratio is expressed in oil equivalent
terms and includes changes resulting
from revisions to previous estimates,
improved recovery and extensions,
and discoveries.
In 2009 we extended our track
record for reported reserves
replacement of more than 100% to
17 consecutive years. We continue
to drive renewal through new access,
exploration, targeted acquisitions and a
strategic focus on increasing resources
from fi elds we currently operate.
30
112
2007
121
2008
129
2009
150
120
90
60
a Combined basis of subsidiaries and
equity-accounted entities, excluding
acquisitions and disposals.
b See footnote f on page 27.
Refi ning availability (%)
Refi ning availability represents Solomon
Associates’ operational availability, which
is defi ned as the percentage of the year
that a unit is available for processing after
subtracting the annualized time lost due
to turnaround activity and all planned
mechanical, process and regulatory
maintenance downtime.
Refi ning availability has increased
signifi cantly each year from 2007 to
2009 and is now at the highest level
since 2005. This has been a key
element in our drive to restore missing
revenues in our operations, with the
biggest contributor being the restoration
of our Texas City refi nery.
20
82.9
2007
88.8
2008
93.6
2009
100
80
60
40
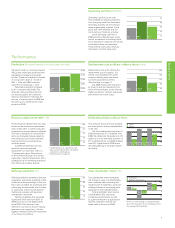
Operating cash fl ow ($ billion)
Operating cash fl ow is net cash
fl ow provided by operating activities,
from the group cash fl ow statement.
Operating activities are the principal
revenue-generating activities of the
group and other activities that are
not investing or fi nancing activities.
Lower operating cash fl ow in
2009 primarily refl ected lower group
profi ts, movements in working capital
and a decrease in dividends from jointly
controlled entities and associates.
These effects were partly offset by
decreases in income taxes paid.
10
24.7
2007
38.1
2008
27.7
2009
50
40
30
20
Replacement cost profi t per ordinary share (cents)
Replacement cost profi t refl ects the
replacement cost of supplies. It is
arrived at by excluding from profi t
inventory holding gains and losses
and their associated tax effect.
(See footnote a on page 1.)
Our 2009 results were impacted
by lower oil and gas realizations and
lower refi ning margins, partly offset by
higher production, stronger operational
performance and lower costs.
40
95.85
2007
136.20
2008
74.49
2009
200
160
120
80
Dividends paid per ordinary share
This measure shows the total dividend
per share paid to ordinary shareholders
in the year.
The total dividend paid per share in
2009 increased by 2% compared with
2008. We determine the dividend in US
dollars as it is the economic currency of
BP. In sterling terms, our 2009 dividend
was 24% higher than in 2008 due to
the strengthening of the dollar relative
to sterling.
9
Cents
Pence
15
42.30
2007
20.995
2007
55.05
2008
29.387
2008
56.00
2009
36.417
2009
75
60
45
30
Total shareholder return represents
the change in value of a shareholding
over a calendar year, assuming that
dividends are re-invested to purchase
additional shares at the closing price
applicable on the ex-dividend date.
Total shareholder return scores
in 2009 refl ect BP’s improving
competitive performance as well
as a general recovery of global stock
markets compared with the low
levels seen at the end of 2008.
Total shareholder returna (%)
-20
2007 2007
2008
-34.6
2008
-15.1
2009 2009
40
20
60
0
ADS basis
Ordinary share basis
6.8 33.0 27.6
14.1
a
There is a small change in comparative data
due to the exclusion of non-trading days from
the average TSR calculation.