BP 2009 Annual Report Download - page 130
Download and view the complete annual report
Please find page 130 of the 2009 BP annual report below. You can navigate through the pages in the report by either clicking on the pages listed below, or by using the keyword search tool below to find specific information within the annual report.-
 1
1 -
2
-
3
-
4
-
5
-
6
-
7
-
8
-
9
-
10
-
11
-
12
-
13
-
14
-
15
-
16
-
17
-
18
-
19
-
20
-
21
-
22
-
23
-
24
-
25
-
26
-
27
-
28
-
29
-
30
-
31
-
32
-
33
-
34
-
35
-
36
-
37
-
38
-
39
-
40
-
41
-
42
-
43
-
44
-
45
-
46
-
47
-
48
-
49
-
50
-
51
-
52
-
53
-
54
-
55
-
56
-
57
-
58
-
59
-
60
-
61
-
62
-
63
-
64
-
65
-
66
-
67
-
68
-
69
-
70
-
71
-
72
-
73
-
74
-
75
-
76
-
77
-
78
-
79
-
80
-
81
-
82
-
83
-
84
-
85
-
86
-
87
-
88
-
89
-
90
-
91
-
92
-
93
-
94
-
95
-
96
-
97
-
98
-
99
-
100
-
101
-
102
-
103
-
104
-
105
-
106
-
107
-
108
-
109
-
110
-
111
-
112
-
113
-
114
-
115
-
116
-
117
-
118
-
119
-
 120
120 -
 121
121 -
 122
122 -
 123
123 -
 124
124 -
 125
125 -
 126
126 -
 127
127 -
 128
128 -
 129
129 -
 130
130 -
 131
131 -
 132
132 -
 133
133 -
 134
134 -
 135
135 -
 136
136 -
 137
137 -
 138
138 -
 139
139 -
 140
140 -
141
-
142
-
143
-
144
-
145
-
146
-
147
-
148
-
149
-
150
-
151
-
152
-
153
-
154
-
155
-
156
-
157
-
158
-
159
-
160
-
161
-
162
-
163
-
164
-
165
-
166
-
167
-
168
-
169
-
170
-
171
-
172
-
173
-
174
-
175
-
176
-
177
-
178
-
179
-
180
-
181
-
182
-
183
-
184
-
185
-
186
-
187
-
188
-
189
-
190
-
191
-
192
-
193
-
194
-
195
-
196
-
197
-
198
-
199
-
200
-
201
-
202
-
203
-
204
-
205
-
206
-
207
-
208
-
209
-
210
-
211
-
212
 |
 |

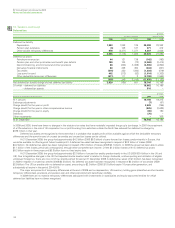
BP Annual Report and Accounts 2009
Notes on financial statements
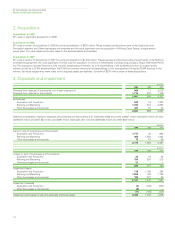
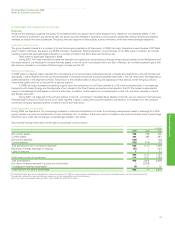
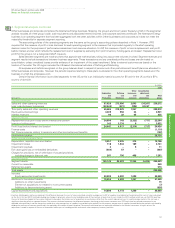
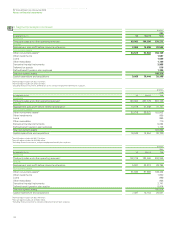
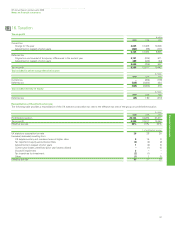
4. Segmental analysis continued
128
$ million
2008
Other Consolidation
Exploration Refining businesses adjustment
and and and and Total
By business Production Marketing corporate eliminations group
Segment revenues
Sales and other operating revenues 86,170 320,039 4,634 (49,700) 361,143
Less: sales between businesses (45,931) (1,918) (1,851) 49,700 –
Third party sales and other operating revenues 40,239 318,121 2,783 – 361,143
Equity-accounted earnings 3,565 131 125 – 3,821
Interest revenues 114 35 220 – 369
Segment results
Replacement cost profit (loss) before interest and taxation 38,308 4,176 (1,223) 466 41,727
Inventory holding lossesa(393) (6,060) (35) – (6,488)
Profit (loss) before interest and taxation 37,915 (1,884) (1,258) 466 35,239
Finance costs (1,547)
Net finance income relating to pensions and other post-retirement benefits 591
Profit before taxation 34,283
Other income statement items
Depreciation, depletion and amortization 8,440 2,208 337 – 10,985
Impairment losses 1,186 159 227 – 1,572
Impairment reversals 155 – – – 155
Fair value (gain) loss on embedded derivatives 163 (57) 5 – 111
Charges for provisions, net of write-back of unused provisions 573 479 657 – 1,709
Segment assets
Segment assets 136,665 75,329 19,079 (3,212) 227,861
Current tax receivable 377
Total assets 228,238
Includes
Equity-accounted investments 20,131 6,622 1,073 – 27,826
Additions to non-current assets 21,584 6,636 1,802 – 30,022
Additions to other investments 52
Element of acquisitions not related to non-current assets 11
Additions to decommissioning asset 615
Capital expenditure and acquisitions 22,227 6,634 1,839 – 30,700
aInventory holding gains and losses represent the difference between the cost of sales calculated using the average cost to BP of supplies incurred during the period and the cost of sales calculated on
the first-in first-out (FIFO) method including any changes in provisions where the net realizable value of the inventory is lower than its cost. Under the FIFO method, which we use for IFRS reporting, the
cost of inventory charged to the income statement is based on the historic cost of acquisition or manufacture rather than the current replacement cost. In volatile energy markets, this can have a
significant distorting effect on reported income. The amounts disclosed represent the difference between the charge to the income statement on a FIFO basis (and any related movements in net
realizable value provisions) and the charge that would arise using average cost of supplies incurred during the period. For this purpose, average cost of supplies incurred during the period is calculated by
dividing the total cost of inventory purchased in the period by the number of barrels acquired. The amounts disclosed are not separately reflected in the financial statements as a gain or loss. No
adjustment is made in respect of the cost of inventories held as part of a trading position and certain other temporary inventory positions.