BP 2009 Annual Report Download - page 136
Download and view the complete annual report
Please find page 136 of the 2009 BP annual report below. You can navigate through the pages in the report by either clicking on the pages listed below, or by using the keyword search tool below to find specific information within the annual report.-
 1
1 -
2
-
3
-
4
-
5
-
6
-
7
-
8
-
9
-
10
-
11
-
12
-
13
-
14
-
15
-
16
-
17
-
18
-
19
-
20
-
21
-
22
-
23
-
24
-
25
-
26
-
27
-
28
-
29
-
30
-
31
-
32
-
33
-
34
-
35
-
36
-
37
-
38
-
39
-
40
-
41
-
42
-
43
-
44
-
45
-
46
-
47
-
48
-
49
-
50
-
51
-
52
-
53
-
54
-
55
-
56
-
57
-
58
-
59
-
60
-
61
-
62
-
63
-
64
-
65
-
66
-
67
-
68
-
69
-
70
-
71
-
72
-
73
-
74
-
75
-
76
-
77
-
78
-
79
-
80
-
81
-
82
-
83
-
84
-
85
-
86
-
87
-
88
-
89
-
90
-
91
-
92
-
93
-
94
-
95
-
96
-
97
-
98
-
99
-
100
-
101
-
102
-
103
-
104
-
105
-
106
-
107
-
108
-
109
-
110
-
111
-
112
-
113
-
114
-
115
-
116
-
117
-
118
-
119
-
120
-
121
-
122
-
123
-
124
-
125
-
 126
126 -
 127
127 -
 128
128 -
 129
129 -
 130
130 -
 131
131 -
 132
132 -
 133
133 -
 134
134 -
 135
135 -
 136
136 -
 137
137 -
 138
138 -
 139
139 -
 140
140 -
 141
141 -
 142
142 -
 143
143 -
 144
144 -
 145
145 -
 146
146 -
147
-
148
-
149
-
150
-
151
-
152
-
153
-
154
-
155
-
156
-
157
-
158
-
159
-
160
-
161
-
162
-
163
-
164
-
165
-
166
-
167
-
168
-
169
-
170
-
171
-
172
-
173
-
174
-
175
-
176
-
177
-
178
-
179
-
180
-
181
-
182
-
183
-
184
-
185
-
186
-
187
-
188
-
189
-
190
-
191
-
192
-
193
-
194
-
195
-
196
-
197
-
198
-
199
-
200
-
201
-
202
-
203
-
204
-
205
-
206
-
207
-
208
-
209
-
210
-
211
-
212
 |
 |

BP Annual Report and Accounts 2009
Notes on financial statements
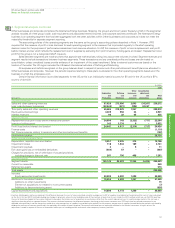
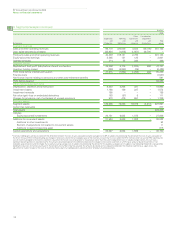
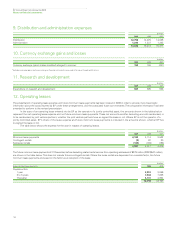
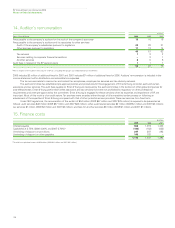
9. Distribution and administration expenses
$ million
2009 2008 2007
Distribution 12,798 14,075 14,028
Administration 1,240 1,337 1,343
14,038 15,412 15,371
10. Currency exchange gains and losses
$ million
2009 2008 2007
Currency exchange (gains) losses (credited) charged to incomea193 156 (201)
aExcludes exchange gains and losses arising on financial instruments measured at fair value through profit or loss.
11. Research and development
$ million
2009 2008 2007
Expenditure on research and development 587 595 566
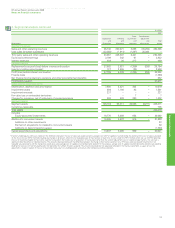
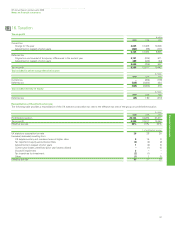
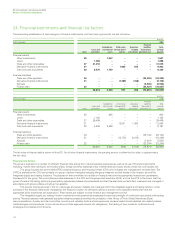
12. Operating leases
134
The presentation of operating lease expense and future minimum lease payments has been revised in 2009 in order to provide more meaningful
information about the costs incurred by BP under these arrangements, and the associated future commitments. The comparative information has been
amended to conform to the revised presentation.
In the case of an operating lease entered into by BP as the operator of a jointly controlled asset, the amounts shown in the tables below
represent the net operating lease expense and net future minimum lease payments. These net amounts are after deducting amounts reimbursed, or
to be reimbursed, by joint venture partners, whether the joint venture partners have co-signed the lease or not. Where BP is not the operator of a
jointly controlled asset, BP’s share of the lease expense and future minimum lease payments is included in the amounts shown, whether BP has
co-signed the lease or not.
The table below shows the expense for the year in respect of operating leases.
$ million
2009 2008 2007
Minimum lease payments 4,109 4,114 3,522
Contingent rentals (9) 97 80
Sub-lease rentals (133) (194) (183)
3,967 4,017 3,419
The future minimum lease payments at 31 December, before deducting related rental income from operating sub-leases of $379 million (2008 $547 million),
are shown in the table below. This does not include future contingent rentals. Where the lease rentals are dependent on a variable factor, the future
minimum lease payments are based on the factor as at inception of the lease.
$ million
Future minimum lease payments 2009 2008
Payable within
1 year 3,251 3,659
2 to 5 years 7,334 7,628
Thereafter 4,131 4,864
14,716 16,151