BP 2009 Annual Report Download - page 62
Download and view the complete annual report
Please find page 62 of the 2009 BP annual report below. You can navigate through the pages in the report by either clicking on the pages listed below, or by using the keyword search tool below to find specific information within the annual report.-
 1
1 -
2
-
3
-
4
-
5
-
6
-
7
-
8
-
9
-
10
-
11
-
12
-
13
-
14
-
15
-
16
-
17
-
18
-
19
-
20
-
21
-
22
-
23
-
24
-
25
-
26
-
27
-
28
-
29
-
30
-
31
-
32
-
33
-
34
-
35
-
36
-
37
-
38
-
39
-
40
-
41
-
42
-
43
-
44
-
45
-
46
-
47
-
48
-
49
-
50
-
51
-
 52
52 -
 53
53 -
 54
54 -
 55
55 -
 56
56 -
 57
57 -
 58
58 -
 59
59 -
 60
60 -
 61
61 -
 62
62 -
 63
63 -
 64
64 -
 65
65 -
 66
66 -
 67
67 -
 68
68 -
 69
69 -
 70
70 -
 71
71 -
 72
72 -
73
-
74
-
75
-
76
-
77
-
78
-
79
-
80
-
81
-
82
-
83
-
84
-
85
-
86
-
87
-
88
-
89
-
90
-
91
-
92
-
93
-
94
-
95
-
96
-
97
-
98
-
99
-
100
-
101
-
102
-
103
-
104
-
105
-
106
-
107
-
108
-
109
-
110
-
111
-
112
-
113
-
114
-
115
-
116
-
117
-
118
-
119
-
120
-
121
-
122
-
123
-
124
-
125
-
126
-
127
-
128
-
129
-
130
-
131
-
132
-
133
-
134
-
135
-
136
-
137
-
138
-
139
-
140
-
141
-
142
-
143
-
144
-
145
-
146
-
147
-
148
-
149
-
150
-
151
-
152
-
153
-
154
-
155
-
156
-
157
-
158
-
159
-
160
-
161
-
162
-
163
-
164
-
165
-
166
-
167
-
168
-
169
-
170
-
171
-
172
-
173
-
174
-
175
-
176
-
177
-
178
-
179
-
180
-
181
-
182
-
183
-
184
-
185
-
186
-
187
-
188
-
189
-
190
-
191
-
192
-
193
-
194
-
195
-
196
-
197
-
198
-
199
-
200
-
201
-
202
-
203
-
204
-
205
-
206
-
207
-
208
-
209
-
210
-
211
-
212
 |
 |

60
BP Annual Report and Accounts 2009
Business review
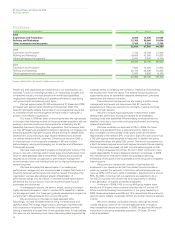
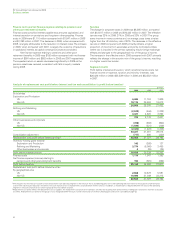
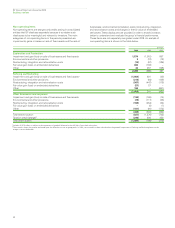
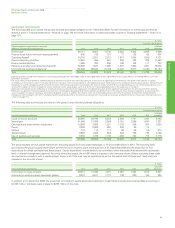
Environmental expenditure
$ million
2009 2008 2007
Operating expenditure 701 755 662
Clean-ups 70 64 62
Capital expenditure 955 1,104 1,033
Additions to environmental remediation provision 588 270 373
Additions to decommissioning provision 169 327 1,163
Operating and capital expenditure on the prevention, control, abatement
or elimination of air, water and solid waste pollution is often not incurred
as a separately identifiable transaction. Instead, it may form part of a
larger transaction that includes, for example, normal maintenance
expenditure. The figures for environmental operating and capital
expenditure in the table are therefore estimates, based on the definitions
and guidelines of the American Petroleum Institute.
Environmental operating expenditure of $701 million in 2009
was lower than in 2008, due to a reduction in new projects undertaken.
In addition, there was a significant reduction in the sulphur oil premium
paid due to a greater use of low-sulphur fuel.
Environmental operating expenditure of $755 million in 2008 was
higher than in 2007 and reflected continuing integrity management
activity. There were no individually significant factors driving the increase.
Similar levels of operating and capital expenditures are expected
in the foreseeable future. In addition to operating and capital
expenditures, we also create provisions for future environmental
remediation. Expenditure against such provisions normally occurs in
subsequent periods and is not included in environmental operating
expenditure reported for such periods. The charge for environmental
remediation provisions in 2009 included $582 million resulting from a
reassessment of existing site obligations and $6 million in respect of
provisions for new sites.
Provisions for environmental remediation are recognized when
a clean-up is probable and the amount of the obligation can be reliably
estimated. Generally, this coincides with the commitment to a formal
plan of action or, if earlier, on divestment or on closure of inactive sites.
The extent and cost of future environmental restoration, remediation and
abatement programmes are inherently difficult to estimate. They often
depend on the extent of contamination, and the associated impact and
timing of the corrective actions required, technological feasibility and
BP’s share of liability. Though the costs of future programmes could be
significant and may be material to the results of operations in the period
in which they are recognized, it is not expected that such costs will be
material to the group’s overall results of operations or financial position.
In addition, we recognize provisions on installation of our oil- and
gas-producing assets and related pipelines to meet the cost of eventual
decommissioning. On installation of an oil or natural gas production
facility a provision is established that represents the discounted value of
the expected future cost of decommissioning the asset. Additionally, we
undertake periodic reviews of existing provisions. These reviews take
account of revised cost assumptions, changes in decommissioning
requirements and any technological developments. The level of increase
in the decommissioning provision varies with the number of new fields
coming onstream in a particular year and the outcome of the periodic
reviews.
Provisions for environmental remediation and decommissioning
are usually recognized on a discounted basis, as required by IAS 37
‘Provisions, Contingent Liabilities and Contingent Assets’.
Further details of decommissioning and environmental provisions
appear in Financial statements – Note 34 on page 160. See also
Environment on pages 47-49.