BP 2009 Annual Report Download - page 41
Download and view the complete annual report
Please find page 41 of the 2009 BP annual report below. You can navigate through the pages in the report by either clicking on the pages listed below, or by using the keyword search tool below to find specific information within the annual report.-
 1
1 -
2
-
3
-
4
-
5
-
6
-
7
-
8
-
9
-
10
-
11
-
12
-
13
-
14
-
15
-
16
-
17
-
18
-
19
-
20
-
21
-
22
-
23
-
24
-
25
-
26
-
27
-
28
-
29
-
30
-
 31
31 -
 32
32 -
 33
33 -
 34
34 -
 35
35 -
 36
36 -
 37
37 -
 38
38 -
 39
39 -
 40
40 -
 41
41 -
 42
42 -
 43
43 -
 44
44 -
 45
45 -
 46
46 -
 47
47 -
 48
48 -
 49
49 -
 50
50 -
 51
51 -
52
-
53
-
54
-
55
-
56
-
57
-
58
-
59
-
60
-
61
-
62
-
63
-
64
-
65
-
66
-
67
-
68
-
69
-
70
-
71
-
72
-
73
-
74
-
75
-
76
-
77
-
78
-
79
-
80
-
81
-
82
-
83
-
84
-
85
-
86
-
87
-
88
-
89
-
90
-
91
-
92
-
93
-
94
-
95
-
96
-
97
-
98
-
99
-
100
-
101
-
102
-
103
-
104
-
105
-
106
-
107
-
108
-
109
-
110
-
111
-
112
-
113
-
114
-
115
-
116
-
117
-
118
-
119
-
120
-
121
-
122
-
123
-
124
-
125
-
126
-
127
-
128
-
129
-
130
-
131
-
132
-
133
-
134
-
135
-
136
-
137
-
138
-
139
-
140
-
141
-
142
-
143
-
144
-
145
-
146
-
147
-
148
-
149
-
150
-
151
-
152
-
153
-
154
-
155
-
156
-
157
-
158
-
159
-
160
-
161
-
162
-
163
-
164
-
165
-
166
-
167
-
168
-
169
-
170
-
171
-
172
-
173
-
174
-
175
-
176
-
177
-
178
-
179
-
180
-
181
-
182
-
183
-
184
-
185
-
186
-
187
-
188
-
189
-
190
-
191
-
192
-
193
-
194
-
195
-
196
-
197
-
198
-
199
-
200
-
201
-
202
-
203
-
204
-
205
-
206
-
207
-
208
-
209
-
210
-
211
-
212
 |
 |

BP Annual Report and Accounts 2009
Business review
Business review
Business review
39
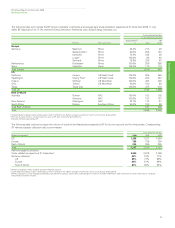
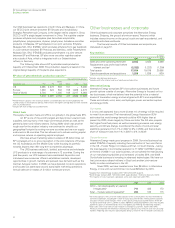
The following table summarizes the BP group’s interests in refineries and average daily crude distillation capacities at 31 December 2009. In July
2009, BP disposed of its 17.1% interest in Kenya Petroleum Refineries Ltd to Essar Energy Overseas Ltd.
thousand barrels per day
Crude distillation capacitiesa
Group interestbBP
Refinery Fuels value chain % Total share
Europe
Germany Bayernoil Rhine 22.5% 215 48
GelsenkirchencRhine 50.0% 266 133
Karlsruhe Rhine 12.0% 323 39
LingencRhine 100.0% 93 93
Schwedt Rhine 18.8% 226 42
Netherlands RotterdamcRhine 100.0% 386 386
Spain CastellóncIberia 100.0% 110 110
Total Europe 1,619 851
US
California CarsoncUS West Coast 100.0% 265 265
Washington Cherry PointcUS West Coast 100.0% 234 234
Indiana WhitingcUS Mid-West 100.0% 405 405
Ohio ToledocUS Mid-West 50.0% 160 80
Texas Texas Cityc– 100.0% 475 475
Total US 1,539 1,459
Rest of World
Australia BulwercANZ 100.0% 102 102
KwinanacANZ 100.0% 137 137
New Zealand Whangerei ANZ 23.7% 112 27
South Africa Durban Southern Africa 50.0% 180 90
Total Rest of World 531 356
To t al 3,689 2,666
aCrude distillation capacity is gross rated capacity, which is defined as the highest average sustained unit rate for a consecutive 30-day period.
bBP share of equity, which is not necessarily the same as BP share of processing entitlements.
cIndicates refineries operated by BP.
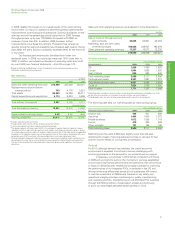
The following table outlines by region the volume of crude oil and feedstock processed by BP for its own account and for third parties. Corresponding
BP refinery capacity utilization data is summarized.
thousand barrels per day
Refinery throughputsa2009 2008 2007
US 1,238 1,121 1,064
Europe 755 739 758
Rest of World 294 295 305
To t al 2,287 2,155 2,127
Refinery capacity utilization
Crude distillation capacity at 31 Decemberb2,666 2,678 2,769
Refinery utilizationc86% 81% 77%
US 85% 77% 69%
Europe 89% 87% 88%
Rest of World 83% 80% 83%
aRefinery throughputs reflect crude oil and other feedstock volumes.
bCrude distillation capacity is gross rated capacity, which is defined as the highest average sustained unit rate for a consecutive 30-day period.
cRefinery utilization is annual throughput divided by crude distillation capacity, expressed as a percentage. The measure has been redefined in 2009 to be more consistent with industry standards.
Prior periods have been restated.