BP 2009 Annual Report Download - page 198
Download and view the complete annual report
Please find page 198 of the 2009 BP annual report below. You can navigate through the pages in the report by either clicking on the pages listed below, or by using the keyword search tool below to find specific information within the annual report.-
 1
1 -
2
-
3
-
4
-
5
-
6
-
7
-
8
-
9
-
10
-
11
-
12
-
13
-
14
-
15
-
16
-
17
-
18
-
19
-
20
-
21
-
22
-
23
-
24
-
25
-
26
-
27
-
28
-
29
-
30
-
31
-
32
-
33
-
34
-
35
-
36
-
37
-
38
-
39
-
40
-
41
-
42
-
43
-
44
-
45
-
46
-
47
-
48
-
49
-
50
-
51
-
52
-
53
-
54
-
55
-
56
-
57
-
58
-
59
-
60
-
61
-
62
-
63
-
64
-
65
-
66
-
67
-
68
-
69
-
70
-
71
-
72
-
73
-
74
-
75
-
76
-
77
-
78
-
79
-
80
-
81
-
82
-
83
-
84
-
85
-
86
-
87
-
88
-
89
-
90
-
91
-
92
-
93
-
94
-
95
-
96
-
97
-
98
-
99
-
100
-
101
-
102
-
103
-
104
-
105
-
106
-
107
-
108
-
109
-
110
-
111
-
112
-
113
-
114
-
115
-
116
-
117
-
118
-
119
-
120
-
121
-
122
-
123
-
124
-
125
-
126
-
127
-
128
-
129
-
130
-
131
-
132
-
133
-
134
-
135
-
136
-
137
-
138
-
139
-
140
-
141
-
142
-
143
-
144
-
145
-
146
-
147
-
148
-
149
-
150
-
151
-
152
-
153
-
154
-
155
-
156
-
157
-
158
-
159
-
160
-
161
-
162
-
163
-
164
-
165
-
166
-
167
-
168
-
169
-
170
-
171
-
172
-
173
-
174
-
175
-
176
-
177
-
178
-
179
-
180
-
181
-
182
-
183
-
184
-
185
-
186
-
187
-
 188
188 -
 189
189 -
 190
190 -
 191
191 -
 192
192 -
 193
193 -
 194
194 -
 195
195 -
 196
196 -
 197
197 -
 198
198 -
 199
199 -
 200
200 -
 201
201 -
 202
202 -
 203
203 -
 204
204 -
 205
205 -
 206
206 -
 207
207 -
 208
208 -
209
-
210
-
211
-
212
 |
 |

BP Annual Report and Accounts 2009
Parent company financial statements of BP p.l.c.
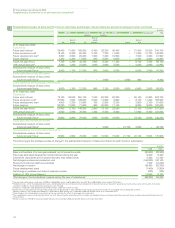
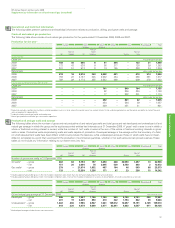
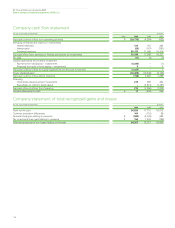
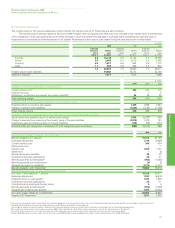
Company cash flow statement
8
1
196
For the year ended 31 December $ million
Note 2009 2008 2007
Net cash (outflow) inflow from operating activities 9 (20,773) (4,399) (833)
Servicing of finance and returns on investments
Interest received 137 167 202
Interest paid (26) (167) (381)
Dividends received 35,187 17,066 16,416
Net cash inflow from servicing of finance and returns on investments 35,298 17,066 16,237
Tax paid (11) (2) (1)
Capital expenditure and financial investment
Payments for fixed assets – investments (4,236) – (7)
Proceeds from sale of fixed assets – investments 9–
Net cash (outflow) inflow for capital expenditure and financial investment (4,227) –
Equity dividends paid (10,483) (10,342) (8,106)
Net cash (outflow) inflow before financing (196) 2,323 7,298
Financing
Other share-based payment movements 213 358 464
Repurchase of ordinary share capital –(2,914) (7,497)
Net cash inflow (outflow) from financing 213 (2,556) (7,033)
Increase (decrease) in cash 917 (233) 265
Company statement of total recognized gains and losses
For the year ended 31 December $ million
2009 2008 2007
Profit for the year 34,524 17,715 16,013
Currency translation differences 104 (710) 89
Actuarial (loss) gain relating to pensions 6 (585) (5,122) 698
Tax on actuarial loss (gain) relating to pensions 2 164 1,434 (195)
Total recognized gains and losses relating to the year 34,207 13,317 16,605