BP 2009 Annual Report Download - page 10
Download and view the complete annual report
Please find page 10 of the 2009 BP annual report below. You can navigate through the pages in the report by either clicking on the pages listed below, or by using the keyword search tool below to find specific information within the annual report.-
 1
1 -
 2
2 -
 3
3 -
 4
4 -
 5
5 -
 6
6 -
 7
7 -
 8
8 -
 9
9 -
 10
10 -
 11
11 -
 12
12 -
 13
13 -
 14
14 -
 15
15 -
 16
16 -
 17
17 -
 18
18 -
 19
19 -
 20
20 -
 21
21 -
22
-
23
-
24
-
25
-
26
-
27
-
28
-
29
-
30
-
31
-
32
-
33
-
34
-
35
-
36
-
37
-
38
-
39
-
40
-
41
-
42
-
43
-
44
-
45
-
46
-
47
-
48
-
49
-
50
-
51
-
52
-
53
-
54
-
55
-
56
-
57
-
58
-
59
-
60
-
61
-
62
-
63
-
64
-
65
-
66
-
67
-
68
-
69
-
70
-
71
-
72
-
73
-
74
-
75
-
76
-
77
-
78
-
79
-
80
-
81
-
82
-
83
-
84
-
85
-
86
-
87
-
88
-
89
-
90
-
91
-
92
-
93
-
94
-
95
-
96
-
97
-
98
-
99
-
100
-
101
-
102
-
103
-
104
-
105
-
106
-
107
-
108
-
109
-
110
-
111
-
112
-
113
-
114
-
115
-
116
-
117
-
118
-
119
-
120
-
121
-
122
-
123
-
124
-
125
-
126
-
127
-
128
-
129
-
130
-
131
-
132
-
133
-
134
-
135
-
136
-
137
-
138
-
139
-
140
-
141
-
142
-
143
-
144
-
145
-
146
-
147
-
148
-
149
-
150
-
151
-
152
-
153
-
154
-
155
-
156
-
157
-
158
-
159
-
160
-
161
-
162
-
163
-
164
-
165
-
166
-
167
-
168
-
169
-
170
-
171
-
172
-
173
-
174
-
175
-
176
-
177
-
178
-
179
-
180
-
181
-
182
-
183
-
184
-
185
-
186
-
187
-
188
-
189
-
190
-
191
-
192
-
193
-
194
-
195
-
196
-
197
-
198
-
199
-
200
-
201
-
202
-
203
-
204
-
205
-
206
-
207
-
208
-
209
-
210
-
211
-
212
 |
 |

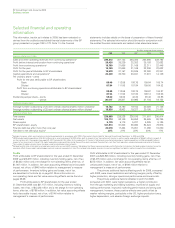
Our performance
Pr ogress in 2009
BP Annual Report and Accounts 2009
Business review
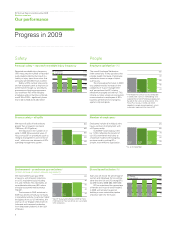
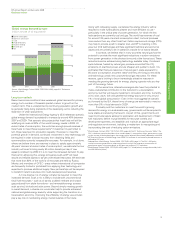
Safety
Personal safety – reported recordable injury frequency
Reported recordable injury frequency
(RIF) measures the number of reported
work-related incidents that result in a
fatality or injury (apart from minor fi rst
aid cases) per 200,000 hours worked.
Safety is BP’s number one priority
and we constantly seek to improve our
performance through our procedures,
processes and training programmes.
Our workforce RIF, which includes
employees and contractors combined,
was 0.34 in 2009 – signifi cantly lower
than 0.43 in 2008 and 0.48 in 2007.
Employees
Contractors
0.15
0.75
0.60
0.45
0.30
0.35 0.59 0.35 0.50 0.23 0.43
2007 2007 2008 2008 2009 2009
Process safety – oil spills
We report all spills of hydrocarbons
greater than or equal to one barrel
(159 litres, 42 US gallons).
The reduction in the number of oil
spills in 2009 follows several years of
focus across BP on procedures such as
‘integrity management’ and ‘control of
work’, which are core elements of BP’s
operating management system. 100
500
400
300
200
340 335 234
2007 2008 2009
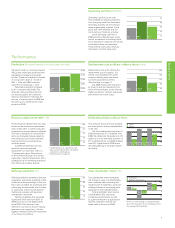
Environment – greenhouse gas emissionsa
(million tonnes of carbon dioxide equivalent)
We report greenhouse gas (GHG)
emissions, and emission reductions,
on a CO2-equivalent basis including
CO2 and methane. This represents all
consolidated entities and BP’s share
of equity-accounted entities except
TNK-BP .
The increase in GHG emissions in
2009 was driven primarily by increases
in operational activity, in particular higher
throughput from our US refi neries, the
start-up of our Tangguh LNG project in
Indonesia and increased production
from deepwater platforms in the Gulf
of Mexico.
20
100
80
60
40
63.5 61.4 65.0
2007 2008 2009
a See BP Sustainability Review 2009 for more
information on how we derive our sustainable
GHG reductions.
People
Employee satisfactiona (%)
The overall Employee Satisfaction
Index comprises 10 key questions that
provide insight into levels of employee
satisfaction across a range of topics
such as pay.
The improved performance in 2009
was underpinned by increases in the
categories of ‘trust in management’
and ‘perceptions that BP is being
effectively managed and well run’. This
refl ects our clear, simple and consistent
communication to employees of BP’s
business performance and progress
against corporate goals.
20
100
80
60
40
66 59 65
2006 2008 2009
a The People Assurance Survey conducted
in 2006 used a census methodology and
targeted the entire BP employee population.
Based on the same set of questions, the
Pulse Plus Survey, in 2008 and 2009,
adopted a sample-based approach, which
achieved a representative view of BP.
Number of employeesa
Employees include all individuals who
have a contract of employment with
a BP group entity.
In 2009 BP total headcount fell
by 11,700, refl ecting the transfer of
our US convenience retail sites to
a franchise model and the progress
we have made in making BP a
simpler, more effi cient organization. 25
125
100
75
50
98,100 92,000 80,300
2007 2008 2009
a As at 31 December.
8
Each year we record the percentage of
women and individuals from countries
other than the UK and US among BP’s
top 492 leaders (2008 583, 2007 624).
BP has maintained the percentage
of female and ‘most-of-world’ leaders
in 2009 and remains focused on
building a more sustainable pipeline
of diverse talent for the future.
Diversity and inclusion (%)
5
Women 25
Non-UK/US
20
15
10
16 19 14 19 14 21
2007 2007 2008 2008 2009 2009