BP 2009 Annual Report Download - page 206
Download and view the complete annual report
Please find page 206 of the 2009 BP annual report below. You can navigate through the pages in the report by either clicking on the pages listed below, or by using the keyword search tool below to find specific information within the annual report.-
 1
1 -
2
-
3
-
4
-
5
-
6
-
7
-
8
-
9
-
10
-
11
-
12
-
13
-
14
-
15
-
16
-
17
-
18
-
19
-
20
-
21
-
22
-
23
-
24
-
25
-
26
-
27
-
28
-
29
-
30
-
31
-
32
-
33
-
34
-
35
-
36
-
37
-
38
-
39
-
40
-
41
-
42
-
43
-
44
-
45
-
46
-
47
-
48
-
49
-
50
-
51
-
52
-
53
-
54
-
55
-
56
-
57
-
58
-
59
-
60
-
61
-
62
-
63
-
64
-
65
-
66
-
67
-
68
-
69
-
70
-
71
-
72
-
73
-
74
-
75
-
76
-
77
-
78
-
79
-
80
-
81
-
82
-
83
-
84
-
85
-
86
-
87
-
88
-
89
-
90
-
91
-
92
-
93
-
94
-
95
-
96
-
97
-
98
-
99
-
100
-
101
-
102
-
103
-
104
-
105
-
106
-
107
-
108
-
109
-
110
-
111
-
112
-
113
-
114
-
115
-
116
-
117
-
118
-
119
-
120
-
121
-
122
-
123
-
124
-
125
-
126
-
127
-
128
-
129
-
130
-
131
-
132
-
133
-
134
-
135
-
136
-
137
-
138
-
139
-
140
-
141
-
142
-
143
-
144
-
145
-
146
-
147
-
148
-
149
-
150
-
151
-
152
-
153
-
154
-
155
-
156
-
157
-
158
-
159
-
160
-
161
-
162
-
163
-
164
-
165
-
166
-
167
-
168
-
169
-
170
-
171
-
172
-
173
-
174
-
175
-
176
-
177
-
178
-
179
-
180
-
181
-
182
-
183
-
184
-
185
-
186
-
187
-
188
-
189
-
190
-
191
-
192
-
193
-
194
-
195
-
 196
196 -
 197
197 -
 198
198 -
 199
199 -
 200
200 -
 201
201 -
 202
202 -
 203
203 -
 204
204 -
 205
205 -
 206
206 -
 207
207 -
 208
208 -
 209
209 -
 210
210 -
 211
211 -
 212
212
 |
 |

BP Annual Report and Accounts 2009
Parent company financial statements of BP p.l.c.
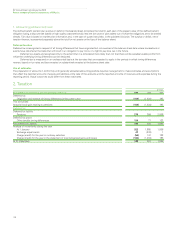
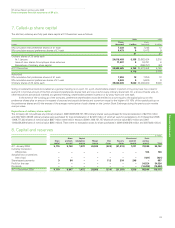
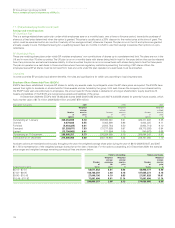
8. Capital and reserves continued
$ million
Share Capital Share-based Profit
Share premium redemption Merger Own Treasury payment and loss
capital account reserve reserve shares shares reserve account Total
At 1 January 2008 5,237 9,581 1,005 26,509 (60) (22,112) 982 72,282 93,424
Currency translation
differences – – – – – – – (710) (710)
Actuarial loss on pensions
(net of tax) – – – – – – – (3,688) (3,688)
Repurchase of ordinary
share capital (67) – 67 – – – – (2,414) (2,414)
Share-based payments 6 182 – – (266) 599 289 (3) 807
Profit for the year – – – – – – – 17,715 17,715
Dividends – – – – – – – (10,342) (10,342)
At 31 December 2008 5,176 9,763 1,072 26,509 (326) (21,513) 1,271 72,840 94,792
As a consolidated income statement is presented for the group, a separate income statement for the parent company is not required to be published.
The profit and loss account reserve includes $24,107 million (2008 $24,107 million and 2007 $27,428 million), the distribution of which is
limited by statutory or other restrictions.
The company does not account for dividends until they have been paid. The accounts for the year ended 31 December 2009 do not reflect the
dividend announced on 2 February 2010 and payable in March 2010; this will be treated as an appropriation of profit in the year ended 31 December 2010.
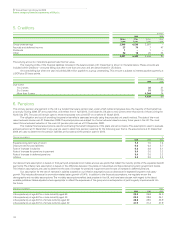
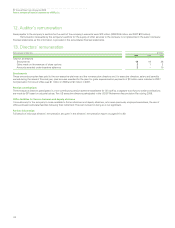
Managing Capital
The company defines capital as the total equity of the company. The company’s objective for managing capital is to deliver competitive, secure and
sustainable returns to maximize long-term shareholder value. BP is not subject to any externally-imposed capital requirements.
The company’s approach to managing capital is set out in its financial framework. The company aims to strike the right balance for
shareholders, between current returns via the dividend, sustained investment for long-term growth, and maintaining a prudent gearing level. At the
beginning of 2008, the company rebalanced distributions away from share buybacks in favour of dividends. During 2009, the company did not
repurchase any of its own shares.
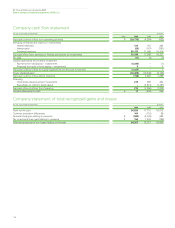
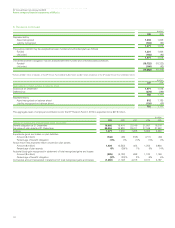
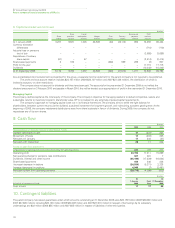
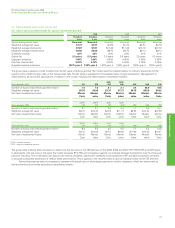
9. Cash flow
$ million
2009 2008 2007
Reconciliation of net cash flow to movement of funds
Increase (decrease) in cash 17 (233) 265
Movement of funds 17 (233) 265
Net cash at 1 January 11 244 (21)
Net cash at 31 December 28 11 244
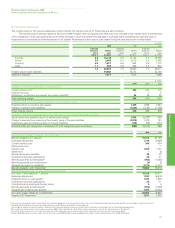
Notes on cash flow statement
(a) Reconciliation of operating profit to net cash (outflow) inflow from operating activities 2009 2008 2007
Operating profit 34,195 17,211 15,699
Net operating charge for pensions, less contributions 321 461 7
Dividends, interest and other income (35,189) (17,239) (16,624)
Share-based payments 444 446 338
(Increase) decrease in debtors (24,584) (5,271) 2,238
Increase (decrease) in creditors 4,040 (7) (2,491)
Net cash outflow from operating activities (20,773) (4,399) (833)
$ million
At At
1 January Cash 31 December
(b) Analysis of movements of funds 2009 flow 2009
Cash at bank 11 17 28
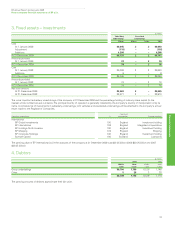
10. Contingent liabilities
The parent company has issued guarantees under which amounts outstanding at 31 December 2009 were $30,158 million (2008 $30,063 million and
2007 $27,665 million), including $30,126 million (2008 $30,008 million and 2007 $27,610 million) in respect of borrowings by its subsidiary
undertakings and $32 million (2008 $55 million and 2007 $55 million) in respect of liabilities of other third parties.
204