BP 2009 Annual Report Download - page 117
Download and view the complete annual report
Please find page 117 of the 2009 BP annual report below. You can navigate through the pages in the report by either clicking on the pages listed below, or by using the keyword search tool below to find specific information within the annual report.-
 1
1 -
2
-
3
-
4
-
5
-
6
-
7
-
8
-
9
-
10
-
11
-
12
-
13
-
14
-
15
-
16
-
17
-
18
-
19
-
20
-
21
-
22
-
23
-
24
-
25
-
26
-
27
-
28
-
29
-
30
-
31
-
32
-
33
-
34
-
35
-
36
-
37
-
38
-
39
-
40
-
41
-
42
-
43
-
44
-
45
-
46
-
47
-
48
-
49
-
50
-
51
-
52
-
53
-
54
-
55
-
56
-
57
-
58
-
59
-
60
-
61
-
62
-
63
-
64
-
65
-
66
-
67
-
68
-
69
-
70
-
71
-
72
-
73
-
74
-
75
-
76
-
77
-
78
-
79
-
80
-
81
-
82
-
83
-
84
-
85
-
86
-
87
-
88
-
89
-
90
-
91
-
92
-
93
-
94
-
95
-
96
-
97
-
98
-
99
-
100
-
101
-
102
-
103
-
104
-
105
-
106
-
 107
107 -
 108
108 -
 109
109 -
 110
110 -
 111
111 -
 112
112 -
 113
113 -
 114
114 -
 115
115 -
 116
116 -
 117
117 -
 118
118 -
 119
119 -
 120
120 -
 121
121 -
 122
122 -
 123
123 -
 124
124 -
 125
125 -
 126
126 -
 127
127 -
128
-
129
-
130
-
131
-
132
-
133
-
134
-
135
-
136
-
137
-
138
-
139
-
140
-
141
-
142
-
143
-
144
-
145
-
146
-
147
-
148
-
149
-
150
-
151
-
152
-
153
-
154
-
155
-
156
-
157
-
158
-
159
-
160
-
161
-
162
-
163
-
164
-
165
-
166
-
167
-
168
-
169
-
170
-
171
-
172
-
173
-
174
-
175
-
176
-
177
-
178
-
179
-
180
-
181
-
182
-
183
-
184
-
185
-
186
-
187
-
188
-
189
-
190
-
191
-
192
-
193
-
194
-
195
-
196
-
197
-
198
-
199
-
200
-
201
-
202
-
203
-
204
-
205
-
206
-
207
-
208
-
209
-
210
-
211
-
212
 |
 |

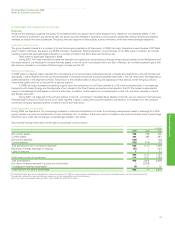
BP Annual Report and Accounts 2009
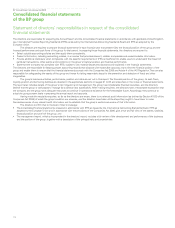
Consolidated financial statements of the BP group
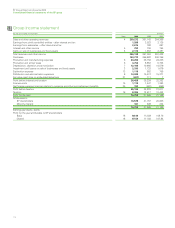
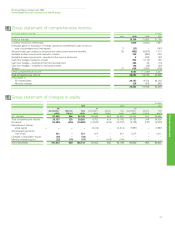
Group cash flow statement
Financial statements
115
For the year ended 31 December $ million
Note 2009 2008 2007
Operating activities
Profit before taxation 25,124 34,283 31,611
Adjustments to reconcile profit before taxation to net cash provided by operating activities
Exploration expenditure written off 13 593 385 347
Depreciation, depletion and amortization 7 12,106 10,985 10,579
Impairment and (gain) loss on sale of businesses and fixed assets 3 160 380 (808)
Earnings from jointly controlled entities and associates (3,901) (3,821) (3,832)
Dividends received from jointly controlled entities and associates 3,003 3,728 2,473
Interest receivable (258) (407) (489)
Interest received 203 385 500
Finance costs 15 1,110 1,547 1,393
Interest paid (909) (1,291) (1,363)
Net finance expense (income) relating to pensions and other post-retirement benefits 35 192 (591) (652)
Share-based payments 450 459 420
Net operating charge for pensions and other post-retirement benefits, less contributions
and benefit payments for unfunded plans (887) (173) (404)
Net charge for provisions, less payments 650 (298) (92)
(Increase) decrease in inventories (5,363) 9,010 (7,255)
Decrease in other current and non-current assets 7,595 2,439 5,210
Decrease in other current and non-current liabilities (5,828) (6,101) (3,857)
Income taxes paid (6,324) (12,824) (9,072)
Net cash provided by operating activities 27,716 38,095 24,709
Investing activities
Capital expenditure (20,650) (22,658) (17,830)
Acquisitions, net of cash acquired 1(395) (1,225)
Investment in jointly controlled entities (578) (1,009) (428)
Investment in associates (164) (81) (187)
Proceeds from disposals of fixed assets 3 1,715 918 1,749
Proceeds from disposals of businesses, net of cash disposed 3 966 11 2,518
Proceeds from loan repayments 530 647 192
Other 47 (200) 374
Net cash used in investing activities (18,133) (22,767) (14,837)
Financing activities
Net issue (repurchase) of shares 207 (2,567) (7,113)
Proceeds from long-term financing 11,567 7,961 8,109
Repayments of long-term financing (6,021) (3,821) (3,192)
Net increase (decrease) in short-term debt (4,405) (1,315) 1,494
Dividends paid
BP shareholders 17 (10,483) (10,342) (8,106)
Minority interest (416) (425) (227)
Net cash used in financing activities (9,551) (10,509) (9,035)
Currency translation differences relating to cash and cash equivalents 110 (184) 135
Increase in cash and cash equivalents 142 4,635 972
Cash and cash equivalents at beginning of year 8,197 3,562 2,590
Cash and cash equivalents at end of year 8,339 8,197 3,562