BP 2009 Annual Report Download - page 44
Download and view the complete annual report
Please find page 44 of the 2009 BP annual report below. You can navigate through the pages in the report by either clicking on the pages listed below, or by using the keyword search tool below to find specific information within the annual report.-
 1
1 -
2
-
3
-
4
-
5
-
6
-
7
-
8
-
9
-
10
-
11
-
12
-
13
-
14
-
15
-
16
-
17
-
18
-
19
-
20
-
21
-
22
-
23
-
24
-
25
-
26
-
27
-
28
-
29
-
30
-
31
-
32
-
33
-
 34
34 -
 35
35 -
 36
36 -
 37
37 -
 38
38 -
 39
39 -
 40
40 -
 41
41 -
 42
42 -
 43
43 -
 44
44 -
 45
45 -
 46
46 -
 47
47 -
 48
48 -
 49
49 -
 50
50 -
 51
51 -
 52
52 -
 53
53 -
 54
54 -
55
-
56
-
57
-
58
-
59
-
60
-
61
-
62
-
63
-
64
-
65
-
66
-
67
-
68
-
69
-
70
-
71
-
72
-
73
-
74
-
75
-
76
-
77
-
78
-
79
-
80
-
81
-
82
-
83
-
84
-
85
-
86
-
87
-
88
-
89
-
90
-
91
-
92
-
93
-
94
-
95
-
96
-
97
-
98
-
99
-
100
-
101
-
102
-
103
-
104
-
105
-
106
-
107
-
108
-
109
-
110
-
111
-
112
-
113
-
114
-
115
-
116
-
117
-
118
-
119
-
120
-
121
-
122
-
123
-
124
-
125
-
126
-
127
-
128
-
129
-
130
-
131
-
132
-
133
-
134
-
135
-
136
-
137
-
138
-
139
-
140
-
141
-
142
-
143
-
144
-
145
-
146
-
147
-
148
-
149
-
150
-
151
-
152
-
153
-
154
-
155
-
156
-
157
-
158
-
159
-
160
-
161
-
162
-
163
-
164
-
165
-
166
-
167
-
168
-
169
-
170
-
171
-
172
-
173
-
174
-
175
-
176
-
177
-
178
-
179
-
180
-
181
-
182
-
183
-
184
-
185
-
186
-
187
-
188
-
189
-
190
-
191
-
192
-
193
-
194
-
195
-
196
-
197
-
198
-
199
-
200
-
201
-
202
-
203
-
204
-
205
-
206
-
207
-
208
-
209
-
210
-
211
-
212
 |
 |

BP Annual Report and Accounts 2009
Business review
Our O&D business has operations in both China and Malaysia. In China,
our SECCO joint venture between BP, Sinopec and its subsidiary,
Shanghai Petrochemical Company, is the largest olefins cracker in China.
SECCO is BP’s single largest investment in China. This naphtha cracker
produces ethylene and propylene plus derivatives acrylonitrile,
polyethylene, polypropylene, styrene, polystyrene, butadiene and other
products. In Malaysia, BP participates in two joint ventures: Ethylene
Malaysia Sdn. Bhd. (EMSB), which produces ethylene from gas feedstock
in a joint venture between BP, Petronas and Idemitsu; while Polyethylene
Malaysia Sdn. Bhd. (PEMSB) produces polyethylene in a joint venture
between BP and Petronas. BP also owns one other naphtha cracker
site outside of Asia, which is integrated with our Gelsenkirchen
refinery in Germany.
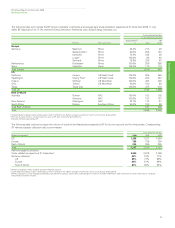
The following table shows BP’s petrochemicals production
capacity at 31 December 2009. This production capacity is based on the
original design capacity of the plants plus expansions.
BP share of petrochemicals production capacitya b
thousand tonnes per year
Acetic
Geographic area PTA PX acid Other O&D Total
US 2,385 2,373 583 151 – 5,492
Europe 1,330 624 532 158 1,629 4,273
Rest of World 3,704 – 1,035 108 3,217 8,064
7,419 2,997 2,150 417 4,846 17,829
aPetrochemicals capacity is the maximum proven sustainable daily rate (msdr) multiplied by the
number of days in the respective period, where msdr is the highest average daily rate ever achieved
over a sustained period.
bIncludes BP share of equity-accounted entities.
Global fuels
The supply of aviation fuels and LPG is run globally in the global fuels SPU.
Air BP is one of the world’s largest and best known aviation fuels
suppliers, serving many of the major commercial airlines as well as the
general aviation and military sectors. During 2009, which was another
tough year for the aviation industry, we continued to simplify our
geographical footprint by exiting non-core countries and we now supply
customers in 64 countries. This has allowed us to reduce working capital
and improve returns on operating capital employed.
We have annual marketing sales in excess of 25 billion litres. Air
BP’s strategic aim is to grow its position in the core locations of Europe,
the US, Australasia and the Middle East, while focusing its portfolio
towards airports that offer long-term competitive advantage.
The LPG business sells bulk, bottled, automotive and wholesale
LPG products to a wide range of customers in 12 countries. During the
past few years, our LPG business has consolidated its position and
introduced new consumer offers in established markets, developed
opportunities in growth markets and pursued new demand such as the
German Autogas market. In 2009, we have divested non-core operations
and focused our asset base around sustainable marketing operations.
Annual sales are in excess of 2 million tonnes per annum.
Other businesses and corporate
Other businesses and corporate comprises the Alternative Energy
business, Shipping, the group’s aluminium asset, Treasury (which
includes interest income on the group’s cash and cash equivalents), and
corporate activities worldwide.
The financial results of Other businesses and corporate are
discussed on page 57.
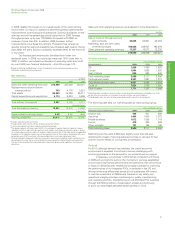
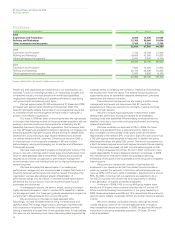
Key statistics
$ million
2009 2008 2007
Sales and other operating revenuesa2,843 4,634 3,698
Replacement cost profit (loss) before
interest and taxb(2,322) (1,223) (1,209)
Total assets 17,954 19,079 20,595
Capital expenditure and acquisitions 1,299 1,839 939
aIncludes sales between businesses.
bIncludes profit after interest and tax of equity-accounted entities.
Alternative Energy
Alternative Energy comprises BP’s low-carbon businesses and future
growth options outside oil and gas. Alternative Energy is focused on four
key businesses, which we believe have the potential to be a material
source of low-carbon energy and are aligned with BP’s core capabilities.
These are biofuels, wind, solar, and hydrogen power and carbon capture
and storage (CCS).
Our market
It is now well accepted that a more diverse mix of energy will be required
to meet future demand. The International Energy Association (IEA)a
estimates that world energy demand could be 40% higher than at
present by 2030, driven largely by China and India. The IEA also projects
that higher fossil-fuel prices, as well as increasing concerns over energy
security and climate change, could boost the share of wind and solar
electricity generation from 1% in 2007 to 6% in 2030, and the biofuels
share of transport fuels from 1% in 2007 to 4% in 2030b.
Our performance
Alternative Energy made good progress in 2009. Our wind business has
added 279MW of capacity including the construction of two wind farms
in the US – Fowler Ridge II in Indiana and Titan I in South Dakota – taking
the total capacity in commercial operation to 711MW (1,237MW gross)
at the end of 2009. In our solar business, we completed the restructuring
of our manufacturing facilities and increased unit sales 25% over 2008.
Our biofuels business is investing in advanced technologies. We have our
first joint-venture ethanol refinery in Brazil and another joint-venture
facility is under construction in the UK.
Since 2005, we have invested more than $4 billioncin Alternative
Energy, in line with our commitment to invest $8 billion by 2015.
aAdapted from World Energy Outlook 2009. ©OECD/IEA 2009, page 73.
bWorld Energy Outlook 2009. ©OECD/IEA 2009, pages 622-623: ‘Reference Scenario, World’.
cThe majority of costs have been capitalized, some were expensed under IFRS.
2009 2008 2007
Wind – net rated capacity at year-end
(megawatts)a711 432 172
Solar – module sales (megawatts)b203 162 115
aNet wind capacity is the sum of the rated capacities of the assets/turbines that have entered into
commercial operation, including BP’s share of equity-accounted entities. The equivalent capacities
on a gross-JV basis (which includes 100% of the capacity of equity-accounted entities where BP
has partial ownership) were 1,237MW in 2009, 785MW in 2008 and 373MW in 2007. This includes
32MW of capacity in the Netherlands that is managed by our Refining and Marketing segment.
bSolar sales are the total sales of solar modules to third-party customers, expressed in MW.
Previously we reported the theoretical cell production capacity of our in-house solar manufacturing
facilities. Reporting sales volumes operating data brings us into line with the broader solar industry.
42