BP 2009 Annual Report Download - page 18
Download and view the complete annual report
Please find page 18 of the 2009 BP annual report below. You can navigate through the pages in the report by either clicking on the pages listed below, or by using the keyword search tool below to find specific information within the annual report.-
 1
1 -
2
-
3
-
4
-
5
-
6
-
7
-
 8
8 -
 9
9 -
 10
10 -
 11
11 -
 12
12 -
 13
13 -
 14
14 -
 15
15 -
 16
16 -
 17
17 -
 18
18 -
 19
19 -
 20
20 -
 21
21 -
 22
22 -
 23
23 -
 24
24 -
 25
25 -
 26
26 -
 27
27 -
 28
28 -
29
-
30
-
31
-
32
-
33
-
34
-
35
-
36
-
37
-
38
-
39
-
40
-
41
-
42
-
43
-
44
-
45
-
46
-
47
-
48
-
49
-
50
-
51
-
52
-
53
-
54
-
55
-
56
-
57
-
58
-
59
-
60
-
61
-
62
-
63
-
64
-
65
-
66
-
67
-
68
-
69
-
70
-
71
-
72
-
73
-
74
-
75
-
76
-
77
-
78
-
79
-
80
-
81
-
82
-
83
-
84
-
85
-
86
-
87
-
88
-
89
-
90
-
91
-
92
-
93
-
94
-
95
-
96
-
97
-
98
-
99
-
100
-
101
-
102
-
103
-
104
-
105
-
106
-
107
-
108
-
109
-
110
-
111
-
112
-
113
-
114
-
115
-
116
-
117
-
118
-
119
-
120
-
121
-
122
-
123
-
124
-
125
-
126
-
127
-
128
-
129
-
130
-
131
-
132
-
133
-
134
-
135
-
136
-
137
-
138
-
139
-
140
-
141
-
142
-
143
-
144
-
145
-
146
-
147
-
148
-
149
-
150
-
151
-
152
-
153
-
154
-
155
-
156
-
157
-
158
-
159
-
160
-
161
-
162
-
163
-
164
-
165
-
166
-
167
-
168
-
169
-
170
-
171
-
172
-
173
-
174
-
175
-
176
-
177
-
178
-
179
-
180
-
181
-
182
-
183
-
184
-
185
-
186
-
187
-
188
-
189
-
190
-
191
-
192
-
193
-
194
-
195
-
196
-
197
-
198
-
199
-
200
-
201
-
202
-
203
-
204
-
205
-
206
-
207
-
208
-
209
-
210
-
211
-
212
 |
 |

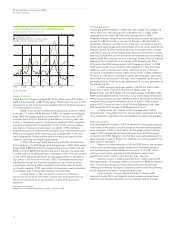
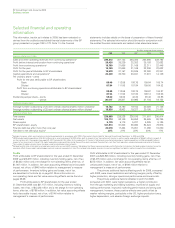
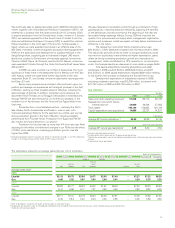
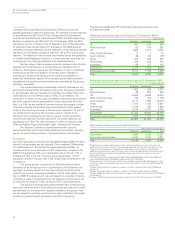
Selected financial and operating
information
This information, insofar as it relates to 2009, has been extracted or
derived from the audited consolidated financial statements of the BP
group presented on pages 109 to 178. Note 1 to the financial
BP Annual Report and Accounts 2009
Business review
statements includes details on the basis of preparation of these financial
statements. The selected information should be read in conjunction with
the audited financial statements and related notes elsewhere herein.
$ million except per share amounts
2009 2008 2007 2006 2005
Income statement data
Sales and other operating revenues from continuing operationsa239,272 361,143 284,365 265,906 239,792
Profit before interest and taxation from continuing operationsa26,426 35,239 32,352 35,158 32,682
Profit from continuing operationsa16,759 21,666 21,169 22,311 22,448
Profit for the year 16,759 21,666 21,169 22,286 22,632
Profit for the year attributable to BP shareholders 16,578 21,157 20,845 22,000 22,341
Capital expenditure and acquisitionsb20,309 30,700 20,641 17,231 14,149
Per ordinary share – cents
Profit for the year attributable to BP shareholders
Basic 88.49 112.59 108.76 109.84 105.74
Diluted 87.54 111.56 107.84 109.00 104.52
Profit from continuing operations attributable to BP shareholdersa
Basic 88.49 112.59 108.76 109.97 104.87
Diluted 87.54 111.56 107.84 109.12 103.66
Dividends paid per share – cents 56.00 55.05 42.30 38.40 34.85
– pence 36.417 29.387 20.995 21.104 19.152
Ordinary share datac
Average number outstanding of 25 cent ordinary shares (shares million undiluted) 18,732 18,790 19,163 20,028 21,126
Average number outstanding of 25 cent ordinary shares (shares million diluted) 18,936 18,963 19,327 20,195 21,411
Balance sheet data
Total assets 235,968 228,238 236,076 217,601 206,914
Net assets 102,113 92,109 94,652 85,465 80,765
Share capital 5,179 5,176 5,237 5,385 5,185
BP shareholders’ equity 101,613 91,303 93,690 84,624 79,976
Finance debt due after more than one year 25,518 17,464 15,651 11,086 10,230
Net debt to net debt plus equityd20% 21% 22% 20% 17%
aExcludes Innovene, which was treated as a discontinued operation in accordance with IFRS 5 ‘Non-current Assets Held for Sale and Discontinued Operations’ in 2005 and 2006.
b2008 included capital expenditure of $2,822 million and an asset exchange of $1,909 million, both in respect of our transaction with Husky, as well as capital expenditure of $3,667 million in respect of
our transactions with Chesapeake (see page 53). 2007 included $1,132 million for the acquisition of Chevron’s Netherlands manufacturing company. Capital expenditure in 2006 included $1 billion in
respect of our investment in Rosneft. All capital expenditure and acquisitions during the past five years have been financed from cash flow from operations, disposal proceeds and external financing.
cThe number of ordinary shares shown has been used to calculate per share amounts.
dNet debt and the ratio of net debt to net debt plus equity ratio are non-GAAP measures. We believe that these measures provide useful information to investors. Net debt enables investors to see the
economic effect of gross debt, related hedges and cash and cash equivalents in total. The net debt ratio enables investors to see how significant net debt is relative to equity from shareholders.
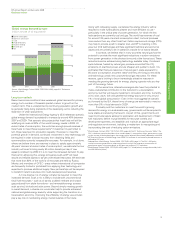
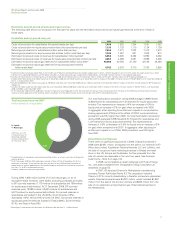
Profits
Profit attributable to BP shareholders for the year ended 31 December
2009 was $16,578 million, including inventory holding gains, net of tax,
of $2,623 million and a net charge for non-operating items, after tax, of
$1,067 million. In addition, fair value accounting effects had a favourable
impact, net of tax, of $445 million relative to management’s measure
of performance. Inventory holding gains and losses, net of tax,
are described in footnote (a) on page 53. More information on
non-operating items and fair value accounting effects can be found on
pages 58-59.
Profit attributable to BP shareholders for the year ended
31 December 2008 was $21,157 million, including inventory holding
losses, net of tax, of $4,436 million and a net charge for non-operating
items, after tax, of $796 million. In addition, fair value accounting effects
had a favourable impact, net of tax, of $146 million relative to
management’s measure of performance.
Profit attributable to BP shareholders for the year ended 31 December
2007 was $20,845 million, including inventory holding gains, net of tax,
of $2,475 million and a net charge for non-operating items, after tax, of
$373 million. In addition, fair value accounting effects had an
unfavourable impact, net of tax, of $198 million relative to
management’s measure of performance.
The primary additional factors affecting profit for 2009, compared
with 2008, were lower realizations and refining margins, partly offset by
higher production, stronger operational performance and lower costs.
The primary additional factors reflected in profit for 2008,
compared with 2007, were higher realizations, a higher contribution
from the gas marketing and trading business, improved oil supply and
trading performance, improved marketing performance and strong cost
management; however, these positive effects were partly offset by
weaker refining margins, particularly in the US, higher production taxes,
higher depreciation, and adverse foreign exchange impacts.
16