BP 2009 Annual Report Download - page 160
Download and view the complete annual report
Please find page 160 of the 2009 BP annual report below. You can navigate through the pages in the report by either clicking on the pages listed below, or by using the keyword search tool below to find specific information within the annual report.-
 1
1 -
2
-
3
-
4
-
5
-
6
-
7
-
8
-
9
-
10
-
11
-
12
-
13
-
14
-
15
-
16
-
17
-
18
-
19
-
20
-
21
-
22
-
23
-
24
-
25
-
26
-
27
-
28
-
29
-
30
-
31
-
32
-
33
-
34
-
35
-
36
-
37
-
38
-
39
-
40
-
41
-
42
-
43
-
44
-
45
-
46
-
47
-
48
-
49
-
50
-
51
-
52
-
53
-
54
-
55
-
56
-
57
-
58
-
59
-
60
-
61
-
62
-
63
-
64
-
65
-
66
-
67
-
68
-
69
-
70
-
71
-
72
-
73
-
74
-
75
-
76
-
77
-
78
-
79
-
80
-
81
-
82
-
83
-
84
-
85
-
86
-
87
-
88
-
89
-
90
-
91
-
92
-
93
-
94
-
95
-
96
-
97
-
98
-
99
-
100
-
101
-
102
-
103
-
104
-
105
-
106
-
107
-
108
-
109
-
110
-
111
-
112
-
113
-
114
-
115
-
116
-
117
-
118
-
119
-
120
-
121
-
122
-
123
-
124
-
125
-
126
-
127
-
128
-
129
-
130
-
131
-
132
-
133
-
134
-
135
-
136
-
137
-
138
-
139
-
140
-
141
-
142
-
143
-
144
-
145
-
146
-
147
-
148
-
149
-
 150
150 -
 151
151 -
 152
152 -
 153
153 -
 154
154 -
 155
155 -
 156
156 -
 157
157 -
 158
158 -
 159
159 -
 160
160 -
 161
161 -
 162
162 -
 163
163 -
 164
164 -
 165
165 -
 166
166 -
 167
167 -
 168
168 -
 169
169 -
 170
170 -
171
-
172
-
173
-
174
-
175
-
176
-
177
-
178
-
179
-
180
-
181
-
182
-
183
-
184
-
185
-
186
-
187
-
188
-
189
-
190
-
191
-
192
-
193
-
194
-
195
-
196
-
197
-
198
-
199
-
200
-
201
-
202
-
203
-
204
-
205
-
206
-
207
-
208
-
209
-
210
-
211
-
212
 |
 |

BP Annual Report and Accounts 2009
Notes on financial statements
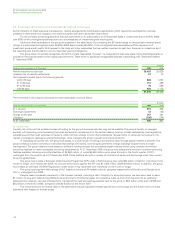
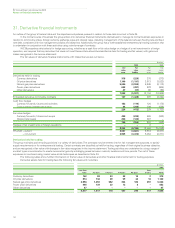
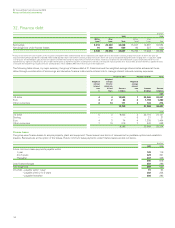
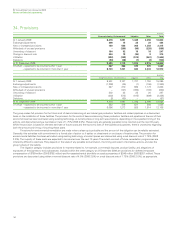
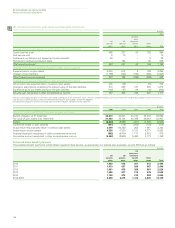
32. Finance debt
158
$ million
2009 2008
Within After Within After
1 year a1 year Total 1 year a1 year Total
Borrowings 9,018 25,020 34,038 15,647 16,937 32,584
Net obligations under finance leases 91 498 589 93 527 620
9,109 25,518 34,627 15,740 17,464 33,204
aAmounts due within one year include current maturities of long-term debt and borrowings that are expected to be repaid later than the earliest contractual repayment dates of within one year. US
Industrial Revenue/Municipal Bonds of $2,895 million (2008 $3,166 million) with earliest contractual repayment dates within one year have expected repayment dates ranging from 1 to 33 years (2008
1 to 40 years). The bondholders typically have the option to tender these bonds for repayment on interest reset dates; however, any bonds that are tendered are usually remarketed and BP has not
experienced any significant repurchases. BP considers these bonds to represent long-term funding when internally assessing the maturity profile of its finance debt. Similar treatment is applied for loans
associated with long-term gas supply contracts totalling $1,622 million (2008 $1,806 million) that mature within eight years.
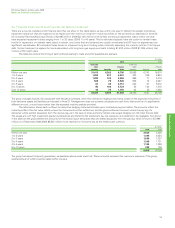
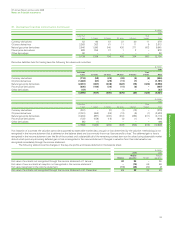
The following table shows, by major currency, the group’s finance debt at 31 December and the weighted average interest rates achieved at those
dates through a combination of borrowings and derivative financial instruments entered into to manage interest rate and currency exposures.
Fixed rate debt Floating rate debt Total
Weighted
Weighted average Weighted
average time for average
interest which rate interest
rate is fixed Amount rate Amount Amount
% Years $ million % $ million $ million
2009
US dollar 4 4 12,525 1 20,566 33,091
Euro 4 2 63 2 1,199 1,262
Other currencies 6 14 171 3 103 274
12,759 21,868 34,627
2008
US dollar 5 3 9,005 2 22,116 31,121
Sterling – – – 6 21 21
Euro 4 3 74 4 1,330 1,404
Other currencies 7 10 216 7 442 658
9,295 23,909 33,204
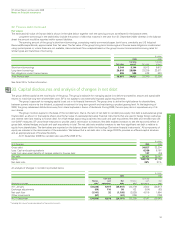
Finance leases
The group uses finance leases to acquire property, plant and equipment. These leases have terms of renewal but no purchase options and escalation
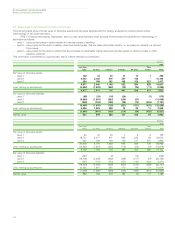
clauses. Renewals are at the option of the lessee. Future minimum lease payments under finance leases are set out below.
$ million
2009 2008
Future minimum lease payments payable within
1 year 109 116
2 to 5 years 329 361
Thereafter 407 439
845 916
Less finance charges 256 296
Net obligations 589 620
Of which – payable within 1 year 91 93
– payable within 2 to 5 years 202 234
– payable thereafter 296 293