BP 2009 Annual Report Download - page 193
Download and view the complete annual report
Please find page 193 of the 2009 BP annual report below. You can navigate through the pages in the report by either clicking on the pages listed below, or by using the keyword search tool below to find specific information within the annual report.-
 1
1 -
2
-
3
-
4
-
5
-
6
-
7
-
8
-
9
-
10
-
11
-
12
-
13
-
14
-
15
-
16
-
17
-
18
-
19
-
20
-
21
-
22
-
23
-
24
-
25
-
26
-
27
-
28
-
29
-
30
-
31
-
32
-
33
-
34
-
35
-
36
-
37
-
38
-
39
-
40
-
41
-
42
-
43
-
44
-
45
-
46
-
47
-
48
-
49
-
50
-
51
-
52
-
53
-
54
-
55
-
56
-
57
-
58
-
59
-
60
-
61
-
62
-
63
-
64
-
65
-
66
-
67
-
68
-
69
-
70
-
71
-
72
-
73
-
74
-
75
-
76
-
77
-
78
-
79
-
80
-
81
-
82
-
83
-
84
-
85
-
86
-
87
-
88
-
89
-
90
-
91
-
92
-
93
-
94
-
95
-
96
-
97
-
98
-
99
-
100
-
101
-
102
-
103
-
104
-
105
-
106
-
107
-
108
-
109
-
110
-
111
-
112
-
113
-
114
-
115
-
116
-
117
-
118
-
119
-
120
-
121
-
122
-
123
-
124
-
125
-
126
-
127
-
128
-
129
-
130
-
131
-
132
-
133
-
134
-
135
-
136
-
137
-
138
-
139
-
140
-
141
-
142
-
143
-
144
-
145
-
146
-
147
-
148
-
149
-
150
-
151
-
152
-
153
-
154
-
155
-
156
-
157
-
158
-
159
-
160
-
161
-
162
-
163
-
164
-
165
-
166
-
167
-
168
-
169
-
170
-
171
-
172
-
173
-
174
-
175
-
176
-
177
-
178
-
179
-
180
-
181
-
182
-
 183
183 -
 184
184 -
 185
185 -
 186
186 -
 187
187 -
 188
188 -
 189
189 -
 190
190 -
 191
191 -
 192
192 -
 193
193 -
 194
194 -
 195
195 -
 196
196 -
 197
197 -
 198
198 -
 199
199 -
 200
200 -
 201
201 -
 202
202 -
 203
203 -
204
-
205
-
206
-
207
-
208
-
209
-
210
-
211
-
212
 |
 |

191
BP Annual Report and Accounts 2009
Supplementary information on oil and natural gas (unaudited)
Financial statements
Operational and statistical information
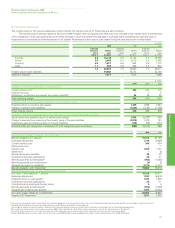
The following tables present operational and statistical information related to production, drilling, productive wells and acreage.
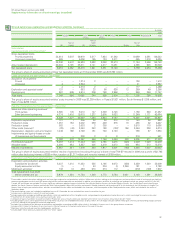
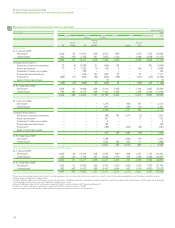
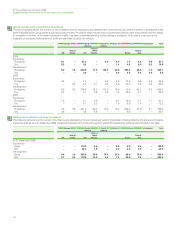
Crude oil and natural gas production
The following table shows crude oil and natural gas production for the years ended 31 December 2009, 2008 and 2007.
Production for the yeara
Europe North South Africa Asia Australasia Total
America America
Rest of
Rest of North Rest of
UK Europe US America Russia Asia
Subsidiaries
Crude oilbthousand barrels per day
2009 168 40 665 8 61 304 – 123 31 1,400
2008 173 43 538 9 66 277 – 128 29 1,263
2007 201 51 513 8 74 195 – 228 34 1,304
Natural gascmillion cubic feet per day
2009 618 16 2,316 263 2,492 621 – 610 514 7,450
2008 759 23 2,157 245 2,532 484 – 696 381 7,277
2007 768 29 2,174 255 2,543 468 – 609 376 7,222
Equity-accounted entities (BP share)
Crude oilbthousand barrels per day
2009 ––––101 – 840 194 – 1,135
2008 ––––92 –826 220 – 1,138
2007 ––––77 –832 201 – 1,110
Natural gascmillion cubic feet per day
2009 ––––392 – 601 42 – 1,035
2008 ––––454 – 564 39 – 1,057
2007 ––––429 – 451 41 – 921
aProduction excludes royalties due to others, whether payable in cash or in kind, where the royalty owner has a direct interest in the underlying production and the option and ability to make lifting and
sales arrangements independently.
bCrude oil includes natural gas liquids and condensate.
cNatural gas production excludes gas consumed in operations.
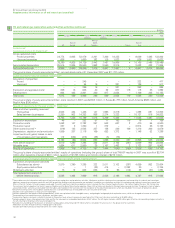
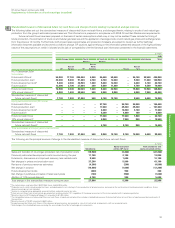
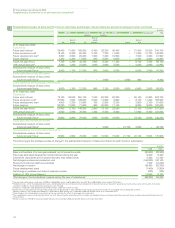
Productive oil and gas wells and acreage
The following tables show the number of gross and net productive oil and natural gas wells and total gross and net developed and undeveloped oil and
natural gas acreage in which the group and its equity-accounted entities had interests as at 31 December 2009. A ‘gross’ well or acre is one in which a
whole or fractional working interest is owned, while the number of ‘net’ wells or acres is the sum of the whole or fractional working interests in gross
wells or acres. Productive wells are producing wells and wells capable of production. Developed acreage is the acreage within the boundary of a field,
on which development wells have been drilled, which could produce the reserves; while undeveloped acres are those on which wells have not been
drilled or completed to a point that would permit the production of commercial quantities, whether or not such acres contain proved reserves. These
tables do not include any information relating to our recent entry into Iraq.
Europe North South Africa Asia Australasia Total
America America
Rest of
Rest of North Rest of
UK Europe US America Russia Asia
Number of productive wells at 31 December 2009
Oil wellsa– gross 282 83 5,793 197 3,650 668 20,593 1,657 13 32,936
– net 151 26 2,090 76 2,045 529 8,750 303 2 13,972
Gas wellsb– gross 279 – 21,974 1,852 487 104 46 563 68 25,373
– net 133 – 12,359 1,236 171 47 23 258 15 14,242
aIncludes approximately 3,982 gross (1,750 net) multiple completion wells (more than one formation producing into the same well bore).
bIncludes approximately 2,834 gross (1,841 net) multiple completion wells. If one of the multiple completions in a well is an oil completion, the well is classified as an oil well.
Europe North South Africa Asia Australasia Total
America America
Rest of
Rest of North Rest of
UK Europe US America Russia Asia
Oil and natural gas acreage at 31 December 2009 Thousands of acres
Developed – gross 366 65 7,587 1,186 1,740 539 4,123 2,191 200 17,997
– net 201 19 4,609 850 470 222 1,794 842 39 9,046
Undevelopeda– gross 1,602 486 7,985 6,967 7,361 105,512 10,357 15,191 4,109 159,570
– net 919 226 4,979 5,009 3,471 33,341 4,683 6,597 911 60,136
aUndeveloped acreage includes leases and concessions.