BP 2009 Annual Report Download - page 56
Download and view the complete annual report
Please find page 56 of the 2009 BP annual report below. You can navigate through the pages in the report by either clicking on the pages listed below, or by using the keyword search tool below to find specific information within the annual report.-
 1
1 -
2
-
3
-
4
-
5
-
6
-
7
-
8
-
9
-
10
-
11
-
12
-
13
-
14
-
15
-
16
-
17
-
18
-
19
-
20
-
21
-
22
-
23
-
24
-
25
-
26
-
27
-
28
-
29
-
30
-
31
-
32
-
33
-
34
-
35
-
36
-
37
-
38
-
39
-
40
-
41
-
42
-
43
-
44
-
45
-
 46
46 -
 47
47 -
 48
48 -
 49
49 -
 50
50 -
 51
51 -
 52
52 -
 53
53 -
 54
54 -
 55
55 -
 56
56 -
 57
57 -
 58
58 -
 59
59 -
 60
60 -
 61
61 -
 62
62 -
 63
63 -
 64
64 -
 65
65 -
 66
66 -
67
-
68
-
69
-
70
-
71
-
72
-
73
-
74
-
75
-
76
-
77
-
78
-
79
-
80
-
81
-
82
-
83
-
84
-
85
-
86
-
87
-
88
-
89
-
90
-
91
-
92
-
93
-
94
-
95
-
96
-
97
-
98
-
99
-
100
-
101
-
102
-
103
-
104
-
105
-
106
-
107
-
108
-
109
-
110
-
111
-
112
-
113
-
114
-
115
-
116
-
117
-
118
-
119
-
120
-
121
-
122
-
123
-
124
-
125
-
126
-
127
-
128
-
129
-
130
-
131
-
132
-
133
-
134
-
135
-
136
-
137
-
138
-
139
-
140
-
141
-
142
-
143
-
144
-
145
-
146
-
147
-
148
-
149
-
150
-
151
-
152
-
153
-
154
-
155
-
156
-
157
-
158
-
159
-
160
-
161
-
162
-
163
-
164
-
165
-
166
-
167
-
168
-
169
-
170
-
171
-
172
-
173
-
174
-
175
-
176
-
177
-
178
-
179
-
180
-
181
-
182
-
183
-
184
-
185
-
186
-
187
-
188
-
189
-
190
-
191
-
192
-
193
-
194
-
195
-
196
-
197
-
198
-
199
-
200
-
201
-
202
-
203
-
204
-
205
-
206
-
207
-
208
-
209
-
210
-
211
-
212
 |
 |

BP Annual Report and Accounts 2009
Business review
Finance costs and net finance expense relating to pensions and
other post-retirement benefits
Finance costs comprise interest payable less amounts capitalized, and
interest accretion on provisions and long-term other payables. Finance
costs in 2009 were $1,110 million compared with $1,547 million in 2008
and $1,393 million in 2007. The decrease in 2009, when compared with
2008, is largely attributable to the reduction in interest rates. The increase
in 2008, when compared with 2007, is largely the outcome of reductions
in capitalized interest as capital construction projects concluded.
Net finance expense relating to pensions and other post-
retirement benefits in 2009 was $192 million compared with net finance
income of $591 million and $652 million in 2008 and 2007 respectively.
The expected return on assets decreased significantly in 2009 as the
pension asset base reduced, consistent with falls in equity markets
during 2008.
Taxation
The charge for corporate taxes in 2009 was $8,365 million, compared
with $12,617 million in 2008 and $10,442 million in 2007. The effective
tax rate was 33% in 2009, 37% in 2008 and 33% in 2007. The group
earns income in many countries and, on average, pays taxes at rates
higher than the UK statutory rate of 28%. The decrease in the effective
tax rate in 2009 compared with 2008 primarily reflects a higher
proportion of income from associates and jointly controlled entities
where tax is included in the pre-tax operating result, foreign exchange
effects and changes to the geographical mix of the group’s income.
The increase in the effective rate in 2008 compared with 2007 primarily
reflects the change in the country mix of the group’s income, resulting
in a higher overall tax burden.
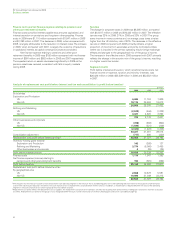
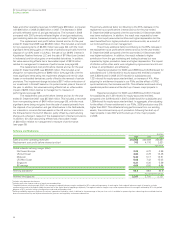
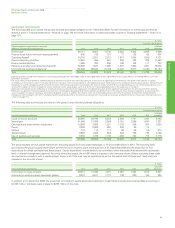
Segment results
Profit before interest and taxation, which is before finance costs, net
finance income or expense, taxation and minority interests, was
$26,426 million in 2009, $35,239 million in 2008 and $32,352 million
in 2007.
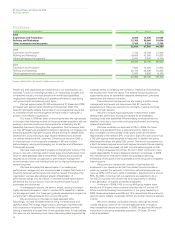
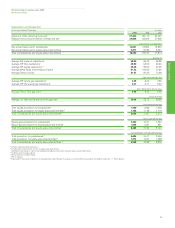
Analysis of replacement cost profit before interest and tax and reconciliation to profit before taxationa
$ million
2009 2008 2007
By business
Exploration and Production
US 6,685 11,724 7,929
Non-US 18,115 26,584 19,673
24,800 38,308 27,602
Refining and Marketing
US (2,578) (644) (1,232)
Non-US 3,321 4,820 3,853
743 4,176 2,621
Other businesses and corporate
US (728) (902) (960)
Non-US (1,594) (321) (249)
(2,322) (1,223) (1,209)
23,221 41,261 29,014
Consolidation adjustment (717) 466 (220)
Replacement cost profit before interest and taxb22,504 41,727 28,794
Inventory holding gains (losses)
Exploration and Production 142 (393) 127
Refining and Marketing 3,774 (6,060) 3,455
Other businesses and corporate 6(35) (24)
Profit before interest and tax 26,426 35,239 32,352
Finance costs 1,110 1,547 1,393
Net finance expense (income) relating to
pensions and other post-retirement benefits 192 (591) (652)
Profit before taxation 25,124 34,283 31,611
Replacement cost profit before interest and tax
By geographical area
US 2,806 10,678 5,581
Non-US 19,698 31,049 23,213
22,504 41,727 28,794
aIFRS requires that the measure of profit or loss disclosed for each operating segment is the measure that is provided regularly to the chief operating decision maker for the purposes of performance
assessment and resource allocation. For BP, this measure of profit or loss is replacement cost profit before interest and tax. In addition, a reconciliation is required between the total of the operating
segments’ measures of profit or loss and the group profit or loss before taxation.
bReplacement cost profit reflects the replacement cost of supplies. The replacement cost profit for the period is arrived at by excluding from profit inventory holding gains and losses and their associated
tax effect. Replacement cost profit for the group is not a recognized GAAP measure. Further information on inventory holding gains and losses is provided on page 53.
54