BP 2009 Annual Report Download - page 63
Download and view the complete annual report
Please find page 63 of the 2009 BP annual report below. You can navigate through the pages in the report by either clicking on the pages listed below, or by using the keyword search tool below to find specific information within the annual report.-
 1
1 -
2
-
3
-
4
-
5
-
6
-
7
-
8
-
9
-
10
-
11
-
12
-
13
-
14
-
15
-
16
-
17
-
18
-
19
-
20
-
21
-
22
-
23
-
24
-
25
-
26
-
27
-
28
-
29
-
30
-
31
-
32
-
33
-
34
-
35
-
36
-
37
-
38
-
39
-
40
-
41
-
42
-
43
-
44
-
45
-
46
-
47
-
48
-
49
-
50
-
51
-
52
-
 53
53 -
 54
54 -
 55
55 -
 56
56 -
 57
57 -
 58
58 -
 59
59 -
 60
60 -
 61
61 -
 62
62 -
 63
63 -
 64
64 -
 65
65 -
 66
66 -
 67
67 -
 68
68 -
 69
69 -
 70
70 -
 71
71 -
 72
72 -
 73
73 -
74
-
75
-
76
-
77
-
78
-
79
-
80
-
81
-
82
-
83
-
84
-
85
-
86
-
87
-
88
-
89
-
90
-
91
-
92
-
93
-
94
-
95
-
96
-
97
-
98
-
99
-
100
-
101
-
102
-
103
-
104
-
105
-
106
-
107
-
108
-
109
-
110
-
111
-
112
-
113
-
114
-
115
-
116
-
117
-
118
-
119
-
120
-
121
-
122
-
123
-
124
-
125
-
126
-
127
-
128
-
129
-
130
-
131
-
132
-
133
-
134
-
135
-
136
-
137
-
138
-
139
-
140
-
141
-
142
-
143
-
144
-
145
-
146
-
147
-
148
-
149
-
150
-
151
-
152
-
153
-
154
-
155
-
156
-
157
-
158
-
159
-
160
-
161
-
162
-
163
-
164
-
165
-
166
-
167
-
168
-
169
-
170
-
171
-
172
-
173
-
174
-
175
-
176
-
177
-
178
-
179
-
180
-
181
-
182
-
183
-
184
-
185
-
186
-
187
-
188
-
189
-
190
-
191
-
192
-
193
-
194
-
195
-
196
-
197
-
198
-
199
-
200
-
201
-
202
-
203
-
204
-
205
-
206
-
207
-
208
-
209
-
210
-
211
-
212
 |
 |

61
BP Annual Report and Accounts 2009
Business review
Business review
Business review
Liquidity and capital resources
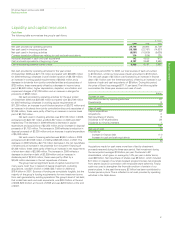
Cash flow
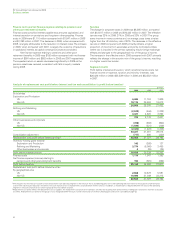
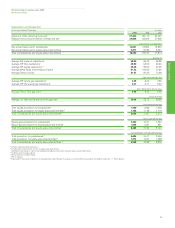
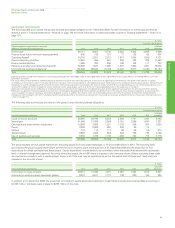
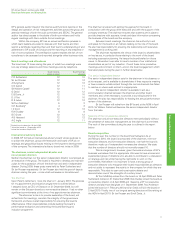
The following table summarizes the group’s cash flows.
$ million
2009 2008 2007
Net cash provided by operating activities 27,716 38,095 24,709
Net cash used in investing activities (18,133) (22,767) (14,837)
Net cash used in financing activities (9,551) (10,509) (9,035)
Currency translation differences relating to cash and cash equivalents 110 (184) 135
Increase (decrease) in cash and cash equivalents 142 4,635 972
Cash and cash equivalents at beginning of year 8,197 3,562 2,590
Cash and cash equivalents at end of year 8,339 8,197 3,562
Net cash provided by operating activities for the year ended
31 December 2009 was $27,716 million compared with $38,095 million
for 2008 reflecting a decrease in profit before taxation of $9,159 million,
an increase in working capital requirements of $8,944 million and a
decrease in dividends from jointly controlled entities and associates of
$725 million; these were partly offset by a decrease in income taxes
paid of $6,500 million, higher depreciation, depletion, amortization and
impairment charges of $1,329 million and an increase in charges for
provisions of $948 million.
Net cash provided by operating activities for the year ended
31 December 2008 was $38,095 million compared with $24,709 million
for 2007 reflecting a decrease in working capital requirements of
$11,250 million, an increase in profit before taxation of $2,672 million and
an increase in dividends from jointly controlled entities and associates of
$1,255 million; these were partly offset by an increase in income taxes
paid of $3,752 million.
Net cash used in investing activities was $18,133 million in 2009,
compared with $22,767 million and $14,837 million in 2008 and 2007
respectively. The decrease in 2009 reflected a decrease in capital
expenditure and acquisitions of $2,356 million and an increase in disposal
proceeds of $1,752 million. The increase in 2008 reflected a reduction in
disposal proceeds of $3,338 million and an increase in capital expenditure
of $5,303 million.
Net cash used in financing activities was $9,551 million in 2009
compared with $10,509 million in 2008 and $9,035 million in 2007. The
decrease in 2009 reflects a $2,774 million decrease in the net repurchase
of shares and an increase in net proceeds from long-term financing of
$1,406 million; these were partly offset by an increase in net repayments
of short-term debt of $3,090 million. The increase in 2008 reflects a
decrease in short-term debt of $2,809 million and an increase in
dividends paid of $2,434 million; these were partly offset by a
$4,546 million decrease in the net repurchase of shares.
The group has had significant levels of capital investment for
many years. Cash flow in respect of capital investment, excluding
acquisitions, was $21.4 billion in 2009, $23.7 billion in 2008 and
$18.4 billion in 2007. Sources of funding are completely fungible, but the
majority of the group’s funding requirements for new investment come
from cash generated by existing operations. The group’s level of net debt,
that is debt less cash and cash equivalents, was $26.2 billion at the end
of 2009, $25.0 billion at the end of 2008 and was $26.8 billion at the end
of 2007.
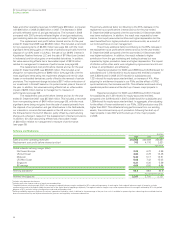
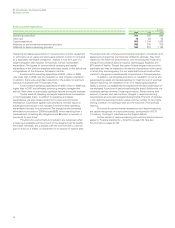
During the period 2007 to 2009, our total sources of cash amounted
to $100 billion, whilst our total uses of cash amounted to $105 billion.
The net cash usage of $5 billion was financed by an increase in finance
debt of $11 billion over the three-year period, offset by an increase in our
balance of cash and cash equivalents of $6 billion. During this period,
the price of Brent has averaged $77.11 per barrel. The following table
summarizes the three-year sources and uses of cash.
$ billion
Sources of cash
Net cash provided by operating activities 91
Divestments 9
100
Uses of cash
Capital expenditure 64
Acquisitions 2
Net repurchase of shares 9
Dividends to BP shareholders 29
Dividends to minority interests 1
105
Net use of cash (5)
Financed by
Increase in finance debt (11)
Increase in cash and cash equivalents 6
(5)
Acquisitions made for cash were more than offset by divestment
proceeds received during the three-year period. Net investment during
the same period averaged $19 billion per year. Dividends to BP
shareholders, which grew on average by 14% per year in dollar terms,
used $29 billion. Net repurchase of shares was $9 billion, which included
$11 billion in respect of our share buyback programme less net proceeds
from shares issued in connection with employee share schemes. Finally,
cash was used to strengthen the financial condition of certain of our
pension plans. In the past three years, $2 billion has been contributed to
funded pension plans. This is reflected in net cash provided by operating
activities in the table above.