BMW 2003 Annual Report Download - page 85
Download and view the complete annual report
Please find page 85 of the 2003 BMW annual report below. You can navigate through the pages in the report by either clicking on the pages listed below, or by using the keyword search tool below to find specific information within the annual report.-
 1
1 -
2
-
3
-
4
-
5
-
6
-
7
-
8
-
9
-
10
-
11
-
12
-
13
-
14
-
15
-
16
-
17
-
18
-
19
-
20
-
21
-
22
-
23
-
24
-
25
-
26
-
27
-
28
-
29
-
30
-
31
-
32
-
33
-
34
-
35
-
36
-
37
-
38
-
39
-
40
-
41
-
42
-
43
-
44
-
45
-
46
-
47
-
48
-
49
-
50
-
51
-
52
-
53
-
54
-
55
-
56
-
57
-
58
-
59
-
60
-
61
-
62
-
63
-
64
-
65
-
66
-
67
-
68
-
69
-
70
-
71
-
72
-
73
-
74
-
 75
75 -
 76
76 -
 77
77 -
 78
78 -
 79
79 -
 80
80 -
 81
81 -
 82
82 -
 83
83 -
 84
84 -
 85
85 -
 86
86 -
 87
87 -
 88
88 -
 89
89 -
 90
90 -
 91
91 -
 92
92 -
 93
93 -
 94
94 -
 95
95 -
96
-
97
-
98
-
99
-
100
-
101
-
102
-
103
-
104
-
105
-
106
-
107
-
108
-
109
-
110
-
111
-
112
-
113
-
114
-
115
-
116
-
117
-
118
-
119
-
120
-
121
-
122
-
123
-
124
-
125
-
126
-
127
-
128
-
129
-
130
-
131
-
132
-
133
-
134
-
135
-
136
-
137
-
138
-
139
-
140
-
141
-
142
-
143
-
144
-
145
-
146
-
147
-
148
-
149
-
150
-
151
-
152
-
153
-
154
-
155
-
156
-
157
-
158
-
159
-
160
-
161
-
162
-
163
-
164
-
165
-
166
-
167
-
168
-
169
-
170
-
171
-
172
-
173
-
174
-
175
-
176
-
177
-
178
-
179
-
180
-
181
-
182
-
183
-
184
-
185
-
186
-
187
-
188
-
189
-
190
-
191
-
192
-
193
-
194
-
195
-
196
-
197
-
198
-
199
-
200
-
201
-
202
-
203
-
204
-
205
-
206
-
207
 |
 |

001 BMW Group in figures
004 Report of the Supervisory Board
008 Supervisory Board
011 Board of Management
012 Group Management Report
12 A Review of the Financial Year
29 Outlook
30 Financial Analysis
44 Risk Management
047 BMW Stock
050 Corporate Governance
054 Group Financial Statements
118 BMW AG Principal Subsidiaries
120 BMW Group10-year Comparison
122 BMW Group Locations
124 Glossary, Index
84
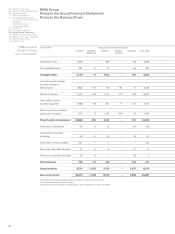
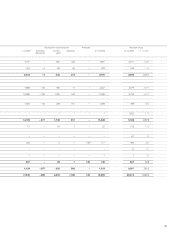
BMW Group
Notes to the Group Financial Statements
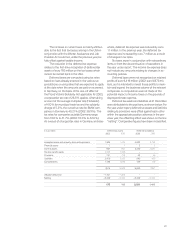
Notes to the Balance Sheet
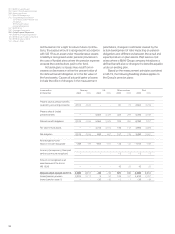
[19]Analysis of
changes in Group
non-current assets
Development costs 4,335 – 996 – 433 4,898
Other intangible assets 461 – 9 97 – 82 467
Intangible assets 4,796 – 9 1,093 – 515 5,365
Land, titles to land, buildings,
including buildings on
third party land 4,625 – 119 190 161 31 4,826
Plant and machinery 15,133 – 299 1,519 474 500 16,327
Other facilities, factory
and office equipment 1,888 – 66 261 – 1 175 1,907
Advance payments made and
construction in progress 1,176 – 6 1,182 – 634 25 1,693
Property, plant and equipment 22,822 – 490 3,152 – 731 24,753
Investments in subsidiaries 138 – 3 73 – 60 148
Investments in associated
companies 42 – 2 54 – 33 61
Investments in other companies 521 – 1 – – 522
Non-current marketable securities 31 – 2 6 – 21 14
Other non-current loans receivable 33 – 3 – – 28 2
Financial assets 765 – 10 134 – 142 747
Leased products 8,591 – 1,239 4,139 – 3,275 8,216
Non-current assets 36,974 – 1,748 8,518 – 4,663 39,081
in euro million Acquisition and manufacturing costs
1.1. 20031]Tr anslation Additions Reclassi- Disposals 31.12.2003
differences fications
1]including the gross balances brought forward of companies consolidated for the first time
2]including impairment losses of euro 56 million
3]fair value measurement changes recognised directly in accumulated other equity (euro 140 million)