BMW 2003 Annual Report Download - page 39
Download and view the complete annual report
Please find page 39 of the 2003 BMW annual report below. You can navigate through the pages in the report by either clicking on the pages listed below, or by using the keyword search tool below to find specific information within the annual report.-
 1
1 -
2
-
3
-
4
-
5
-
6
-
7
-
8
-
9
-
10
-
11
-
12
-
13
-
14
-
15
-
16
-
17
-
18
-
19
-
20
-
21
-
22
-
23
-
24
-
25
-
26
-
27
-
28
-
 29
29 -
 30
30 -
 31
31 -
 32
32 -
 33
33 -
 34
34 -
 35
35 -
 36
36 -
 37
37 -
 38
38 -
 39
39 -
 40
40 -
 41
41 -
 42
42 -
 43
43 -
 44
44 -
 45
45 -
 46
46 -
 47
47 -
 48
48 -
 49
49 -
50
-
51
-
52
-
53
-
54
-
55
-
56
-
57
-
58
-
59
-
60
-
61
-
62
-
63
-
64
-
65
-
66
-
67
-
68
-
69
-
70
-
71
-
72
-
73
-
74
-
75
-
76
-
77
-
78
-
79
-
80
-
81
-
82
-
83
-
84
-
85
-
86
-
87
-
88
-
89
-
90
-
91
-
92
-
93
-
94
-
95
-
96
-
97
-
98
-
99
-
100
-
101
-
102
-
103
-
104
-
105
-
106
-
107
-
108
-
109
-
110
-
111
-
112
-
113
-
114
-
115
-
116
-
117
-
118
-
119
-
120
-
121
-
122
-
123
-
124
-
125
-
126
-
127
-
128
-
129
-
130
-
131
-
132
-
133
-
134
-
135
-
136
-
137
-
138
-
139
-
140
-
141
-
142
-
143
-
144
-
145
-
146
-
147
-
148
-
149
-
150
-
151
-
152
-
153
-
154
-
155
-
156
-
157
-
158
-
159
-
160
-
161
-
162
-
163
-
164
-
165
-
166
-
167
-
168
-
169
-
170
-
171
-
172
-
173
-
174
-
175
-
176
-
177
-
178
-
179
-
180
-
181
-
182
-
183
-
184
-
185
-
186
-
187
-
188
-
189
-
190
-
191
-
192
-
193
-
194
-
195
-
196
-
197
-
198
-
199
-
200
-
201
-
202
-
203
-
204
-
205
-
206
-
207
 |
 |
001 BMW Group in figures
004 Report of the Supervisory Board
008 Supervisory Board
011 Board of Management
012 Group Management Report
12 A Review of the Financial Year
29 Outlook
30 Financial Analysis
44 Risk Management
047 BMW Stock
050 Corporate Governance
054 Group Financial Statements
118 BMW AG Principal Subsidiaries
120 BMW Group10-year Comparison
122 BMW Group Locations
124 Glossary, Index
38
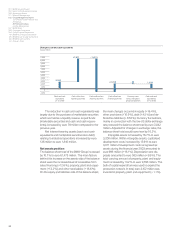
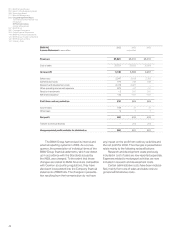
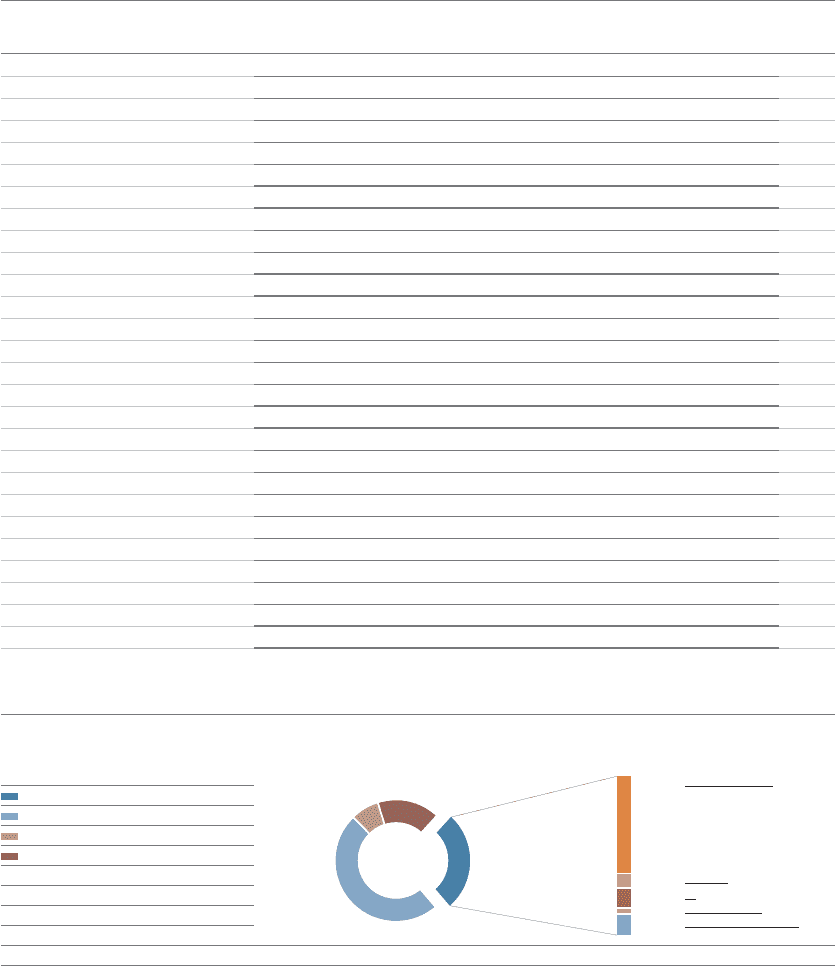
BMW Group value added 2003
in %
Net added value
Cost of materials
Depreciation and amortisation
Other expenses
16.5
7. 6
48.9
27.0
61.2 %
9.3 %
12.6 %
3.4 %
13.5 %
Employees
Providers of finance
Government/public sector
Shareholders
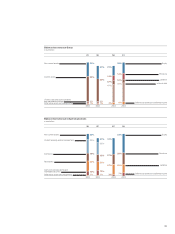
Group
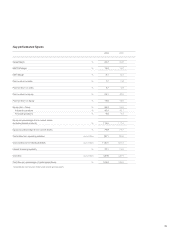
in euro million 2003 2003 2002 2002 Change
in % reclassified in % in %
Work performed
Revenues 41,525 97.1 42,411 96.6
Financial income 148 0.3 409 0.9
Other income 1,111 2.6 1,077 2.5
Total Group output 42,784 100.0 43,897 100.0 – 2.5
Cost of materials 20,905 48.9 21,955 50.0
Other expenses 7,074 16.5 7,335 16.7
Bought-in costs 27,979 65.4 29,290 66.7 – 4.5
Gross added value 14,805 34.6 14,607 33.3 1.4
Depreciation and amortisation 3,255 7.6 2,902 6.6
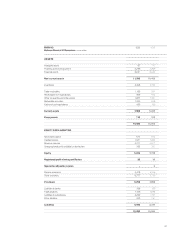
Net added value 11,550 27.0 11,705 26.7 – 1.3
Applied to:
Employees 7,066 61.2 6,588 56.3 7.3
Providers of finance 1,077 9.3 1,629 13.9 –33.9
Government/public sector 1,460 12.6 1,468 12.5 – 0.5
Shareholders 392 3.4 351 3.0 11.7
Group 1,555 13.5 1,669 14.3 –6.8
Net added value 11,550 100.0 11,705 100.0 – 1.3
BMW Group value added statement