BMW 2003 Annual Report Download - page 66
Download and view the complete annual report
Please find page 66 of the 2003 BMW annual report below. You can navigate through the pages in the report by either clicking on the pages listed below, or by using the keyword search tool below to find specific information within the annual report.-
 1
1 -
2
-
3
-
4
-
5
-
6
-
7
-
8
-
9
-
10
-
11
-
12
-
13
-
14
-
15
-
16
-
17
-
18
-
19
-
20
-
21
-
22
-
23
-
24
-
25
-
26
-
27
-
28
-
29
-
30
-
31
-
32
-
33
-
34
-
35
-
36
-
37
-
38
-
39
-
40
-
41
-
42
-
43
-
44
-
45
-
46
-
47
-
48
-
49
-
50
-
51
-
52
-
53
-
54
-
55
-
 56
56 -
 57
57 -
 58
58 -
 59
59 -
 60
60 -
 61
61 -
 62
62 -
 63
63 -
 64
64 -
 65
65 -
 66
66 -
 67
67 -
 68
68 -
 69
69 -
 70
70 -
 71
71 -
 72
72 -
 73
73 -
 74
74 -
 75
75 -
 76
76 -
77
-
78
-
79
-
80
-
81
-
82
-
83
-
84
-
85
-
86
-
87
-
88
-
89
-
90
-
91
-
92
-
93
-
94
-
95
-
96
-
97
-
98
-
99
-
100
-
101
-
102
-
103
-
104
-
105
-
106
-
107
-
108
-
109
-
110
-
111
-
112
-
113
-
114
-
115
-
116
-
117
-
118
-
119
-
120
-
121
-
122
-
123
-
124
-
125
-
126
-
127
-
128
-
129
-
130
-
131
-
132
-
133
-
134
-
135
-
136
-
137
-
138
-
139
-
140
-
141
-
142
-
143
-
144
-
145
-
146
-
147
-
148
-
149
-
150
-
151
-
152
-
153
-
154
-
155
-
156
-
157
-
158
-
159
-
160
-
161
-
162
-
163
-
164
-
165
-
166
-
167
-
168
-
169
-
170
-
171
-
172
-
173
-
174
-
175
-
176
-
177
-
178
-
179
-
180
-
181
-
182
-
183
-
184
-
185
-
186
-
187
-
188
-
189
-
190
-
191
-
192
-
193
-
194
-
195
-
196
-
197
-
198
-
199
-
200
-
201
-
202
-
203
-
204
-
205
-
206
-
207
 |
 |
65
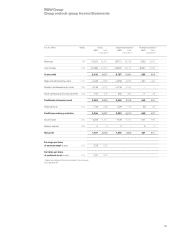
Cost of sales comprises the cost of manufac-
turing
products and the acquisition cost of purchased
merchandise which have been sold. It includes all
directly attributable material and production costs
and all indirect production overheads. These include
depreciation of property, plant and equipment and
amortisation of other intangible assets relating to
production and write-downs on inventories. Cost of
sales also includes freight and insurance costs re-
lating to deliveries to dealers and agency fees in the
case of direct sales. Expenses which are directly at-
tributable to financial services business and interest
expense from refinancing the entire financial services
business, including the expense of risk provisions
and write-downs, are reported in cost of sales. Cost
of sales for the financial operations sub-group also
includes the interest expense of group financing
companies.
Research costs and development costs
which are not capitalised are recognised as an
expense when incurred.
In accordance with IAS 20 (Accounting for
Government Grants and Disclosure of Government
Assistance) public sector grants are not recognised
until there is reasonable assurance that the condi-
tions attaching to them have been complied with
and the grants will be received. They are recognised
as income over the periods necessary to match
them with the related costs which they are intended
to compensate.
Basic earnings per share are computed in
accordance with IAS 33 (Earnings per Share). Un-
diluted earnings per share are calculated for ordi-
nary and preferred stock shares by dividing the net
profit attributable to each category of stock – net of
minority interests – by the average number of out-
standing shares. The net profit is accordingly allo-
cated to the different categories of shares. The por-
tion of the group net profit for the year which is
not being distributed is allocated to each category
of stock based on the number of outstanding
shares. Net profit available for distribution is allocated
in accordance with the actual payment. Diluted
earnings per share would have to be disclosed
separately.
Purchased and internally generated intangible
assets are recognised as assets in accordance
with IAS 38 (Intangible Assets), where it is probable
that the use of the asset will generate future eco-
nomic benefits and where the costs of the asset can
be determined reliably. Such assets are measured
at acquisition and manufacturing cost and amortised
on a straight-line basis over their estimated useful
lives. With the exception of goodwill and capitalised
development costs, intangible assets are generally
amortised over their estimated useful lives of between
three and five years.
Development costs for vehicle and engine
projects are capitalised at production cost, to the
extent that the costs can be allocated reliably and
the technical feasibility and marketing are assured. It
must also be probable that development expenditure
will generate future economic benefits. Capitalised
development costs comprise all expenditure that
can be attributed directly to the development pro-
cess and an appropriate proportion of development-
related overheads. Capitalised development costs
are amortised on a systematic basis following the
commencement of production over the estimated
product life which is generally seven years.
All items of property, plant and equipment
are considered to have finite useful lives. They are
stated at acquisition or manufacturing cost less
systematic depreciation based on the estimated
useful lives of the assets. Depreciation on property,
plant and equipment reflects the pattern of their
usage and is generally computed using the straight-
line method.