BMW 2003 Annual Report Download - page 24
Download and view the complete annual report
Please find page 24 of the 2003 BMW annual report below. You can navigate through the pages in the report by either clicking on the pages listed below, or by using the keyword search tool below to find specific information within the annual report.
23
At 38.9%, the proportion of development costs
recognised as assets remains relatively low in com-
parison to the industry as a whole.
A significant part of this expenditure related to
the continued expansion of the internal and external
production network and of the sales network. In
particular, the new BMW plant in Leipzig will gener-
ate a sharp increase in production capacity from next
year onwards. By 2005, the BMW Group will have
invested some euro 1.3 billion in the Leipzig produc-
tion plant site.
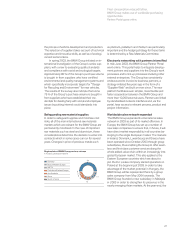
Including capitalised development costs, the
investment rate (i.e. capital expenditure as a per-
centage of group revenues) increased to 10.2% in
2003, which is higher than the previous highest rate
recorded in 2002 (9.5%). This above-average i
n-
creasewas mainly attributable to the currency-related
lower level of revenues.
Cash flow in 2003, at euro 4,490 million, was
again higher than capital expenditure.
In conjunction with extensive product measures,
intensified market activities and the production start-
up phase at the BMW plant in Leipzig, the Group’s
capital expenditure in 2004 will remain at a high
level. The investment rate will, however, be lower.
Customer orientation integrated into business
processes
The “Customer-Orientated Sales and Production
Process” (KOVP) was further extended in 2003, with
more than 90% of the BMW Group’s sales volume
now being processed by this system. KOVP pro-
vides the BMW Group with an instrument with which
to respond quickly and flexibly to the wishes of
indi-
vidual customers. It is possible to alter orders for cars
up to ten days before the start of production. This
opportunity is used worldwide more than 120,000
times each month, usually to make changes for ad-
ditional equipment.
Production logistics have also been remodelled
using KOVP: not only is it possible to offer the cus-
tomer faster and more individual service, but costs
have also been reduced through shorter processing
times, whilst quality has improved.
Cash flow exceeds capital expenditure.
Continued progress in the area of environmental care.
Substantial capital expenditure for the production
network.
BMW Group capital expenditure and cash flow
in euro million
6,500
6,000
5,500
5,000
4,500
4,000
3,500
3,000
2,500
2,000
1,500
1,000
500
Capital expenditure Cash flow
99
HGB
2,155
2,807
00
HGB
2,138
3,198
00
IAS
2,781
3,779
01
IAS
3,516
4,202
02
IAS
4,042
4,374
03
IAS
4,245
4,490


