BMW 2003 Annual Report Download - page 56
Download and view the complete annual report
Please find page 56 of the 2003 BMW annual report below. You can navigate through the pages in the report by either clicking on the pages listed below, or by using the keyword search tool below to find specific information within the annual report.-
 1
1 -
2
-
3
-
4
-
5
-
6
-
7
-
8
-
9
-
10
-
11
-
12
-
13
-
14
-
15
-
16
-
17
-
18
-
19
-
20
-
21
-
22
-
23
-
24
-
25
-
26
-
27
-
28
-
29
-
30
-
31
-
32
-
33
-
34
-
35
-
36
-
37
-
38
-
39
-
40
-
41
-
42
-
43
-
44
-
45
-
 46
46 -
 47
47 -
 48
48 -
 49
49 -
 50
50 -
 51
51 -
 52
52 -
 53
53 -
 54
54 -
 55
55 -
 56
56 -
 57
57 -
 58
58 -
 59
59 -
 60
60 -
 61
61 -
 62
62 -
 63
63 -
 64
64 -
 65
65 -
 66
66 -
67
-
68
-
69
-
70
-
71
-
72
-
73
-
74
-
75
-
76
-
77
-
78
-
79
-
80
-
81
-
82
-
83
-
84
-
85
-
86
-
87
-
88
-
89
-
90
-
91
-
92
-
93
-
94
-
95
-
96
-
97
-
98
-
99
-
100
-
101
-
102
-
103
-
104
-
105
-
106
-
107
-
108
-
109
-
110
-
111
-
112
-
113
-
114
-
115
-
116
-
117
-
118
-
119
-
120
-
121
-
122
-
123
-
124
-
125
-
126
-
127
-
128
-
129
-
130
-
131
-
132
-
133
-
134
-
135
-
136
-
137
-
138
-
139
-
140
-
141
-
142
-
143
-
144
-
145
-
146
-
147
-
148
-
149
-
150
-
151
-
152
-
153
-
154
-
155
-
156
-
157
-
158
-
159
-
160
-
161
-
162
-
163
-
164
-
165
-
166
-
167
-
168
-
169
-
170
-
171
-
172
-
173
-
174
-
175
-
176
-
177
-
178
-
179
-
180
-
181
-
182
-
183
-
184
-
185
-
186
-
187
-
188
-
189
-
190
-
191
-
192
-
193
-
194
-
195
-
196
-
197
-
198
-
199
-
200
-
201
-
202
-
203
-
204
-
205
-
206
-
207
 |
 |

55
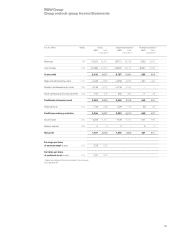
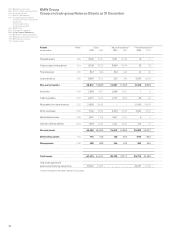
BMW Group
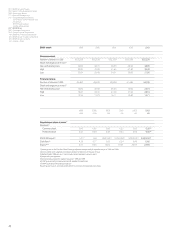
Group and sub-group Income Statements
in euro million Notes Group Industrial operations1]Financial operations1]
2003 2002 2003 2002 2003 2002
reclassified
2]
reclassified
2]
reclassified
2]
Revenues [9]41,525 42,411 39,712 39,706 7,822 8,605
Cost of sales [10]– 32,090 – 32,754 – 30,925 – 30,712 –6,857 –7,700
Gross profit 9,435 9,657 8,787 8,994 965 905
Sales and administrative costs [11]–4,446 – 4,389 – 4,058 – 4,009 – 407 – 403
Research and development costs [12]–2,146 –2,133 –2,146 –2,133 ––
Other operating income and expenses [13]510 370 469 300 11 49
Profit before financial result 3,353 3,505 3,052 3,152 569 551
Financial result [14]– 148 –208 – 229 – 179 89 –20
Profit from ordinary activities 3,205 3,297 2,823 2,973 658 531
Income taxes [15]–1,258 –1,277 –1,128 –1,173 – 231 –180
Minority interest [16]000–00
Net profit 1,947 2,020 1,695 1,800 427 351
Earnings per share
of common stock in euro [17]2.89 3.00
Earnings per share
of preferred stock in euro [17]2.91 3.02
1]before consolidation of transactions between the sub-groups
2]see also Note [7]