BMW 2003 Annual Report Download - page 59
Download and view the complete annual report
Please find page 59 of the 2003 BMW annual report below. You can navigate through the pages in the report by either clicking on the pages listed below, or by using the keyword search tool below to find specific information within the annual report.-
 1
1 -
2
-
3
-
4
-
5
-
6
-
7
-
8
-
9
-
10
-
11
-
12
-
13
-
14
-
15
-
16
-
17
-
18
-
19
-
20
-
21
-
22
-
23
-
24
-
25
-
26
-
27
-
28
-
29
-
30
-
31
-
32
-
33
-
34
-
35
-
36
-
37
-
38
-
39
-
40
-
41
-
42
-
43
-
44
-
45
-
46
-
47
-
48
-
 49
49 -
 50
50 -
 51
51 -
 52
52 -
 53
53 -
 54
54 -
 55
55 -
 56
56 -
 57
57 -
 58
58 -
 59
59 -
 60
60 -
 61
61 -
 62
62 -
 63
63 -
 64
64 -
 65
65 -
 66
66 -
 67
67 -
 68
68 -
 69
69 -
70
-
71
-
72
-
73
-
74
-
75
-
76
-
77
-
78
-
79
-
80
-
81
-
82
-
83
-
84
-
85
-
86
-
87
-
88
-
89
-
90
-
91
-
92
-
93
-
94
-
95
-
96
-
97
-
98
-
99
-
100
-
101
-
102
-
103
-
104
-
105
-
106
-
107
-
108
-
109
-
110
-
111
-
112
-
113
-
114
-
115
-
116
-
117
-
118
-
119
-
120
-
121
-
122
-
123
-
124
-
125
-
126
-
127
-
128
-
129
-
130
-
131
-
132
-
133
-
134
-
135
-
136
-
137
-
138
-
139
-
140
-
141
-
142
-
143
-
144
-
145
-
146
-
147
-
148
-
149
-
150
-
151
-
152
-
153
-
154
-
155
-
156
-
157
-
158
-
159
-
160
-
161
-
162
-
163
-
164
-
165
-
166
-
167
-
168
-
169
-
170
-
171
-
172
-
173
-
174
-
175
-
176
-
177
-
178
-
179
-
180
-
181
-
182
-
183
-
184
-
185
-
186
-
187
-
188
-
189
-
190
-
191
-
192
-
193
-
194
-
195
-
196
-
197
-
198
-
199
-
200
-
201
-
202
-
203
-
204
-
205
-
206
-
207
 |
 |

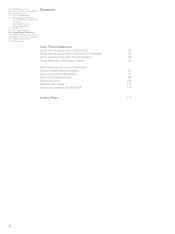
001 BMW Group in figures
004 Report of the Supervisory Board
008 Supervisory Board
011 Board of Management
012 Group Management Report
12 A Review of the Financial Year
29 Outlook
30 Financial Analysis
44 Risk Management
047 BMW Stock
050 Corporate Governance
054 Group Financial Statements
118 BMW AG Principal Subsidiaries
120 BMW Group10-year Comparison
122 BMW Group Locations
124 Glossary, Index
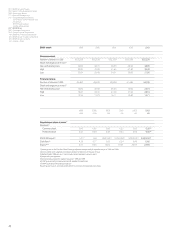
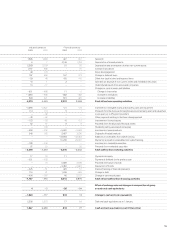
58
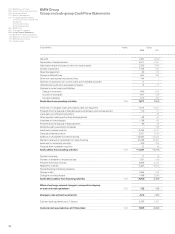
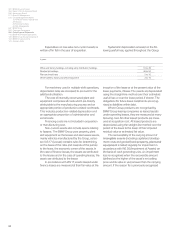
BMW Group
Group and sub-group Cash Flow Statements
in euro million Notes Group
2003 2002
Net profit 1,947 2,020
Depreciation of leased products 2,511 2,167
Depreciation and amortisation of other non-current assets 2,390 2,149
Increase in provisions 1,155 924
Rover disengagement 49 174
Change in deferred taxes 853 993
Other non-cash income and expense items –144 1
Gain/loss on disposal of non-current assets and marketable securities – 4 1
Undistributed results from associated companies 13 –17
Changes in current assets and liabilities
Change in inventories – 640 – 810
Increase in receivables – 877 –749
Increase in liabilities 618 397
Cash inflow from operating activities [38]7,871 7,250
Investment in intangible assets and property, plant and equipment – 4,115 – 3,951
Proceeds from the disposal of intangible assets and property, plant and equipment 119 111
Loans paid out to Phoenix Consortium – –92
Other payments relating to the Rover disengagement – 49 –82
Investment in financial assets –148 –62
Proceeds from the disposal of financial assets 60 66
Dividends paid by associated companies – 104
Investment in leased products – 5,785 – 5,741
Disposals of leased products 2,707 3,298
Additions to receivables from sales financing – 34,593 – 32,463
Payments received on receivables from sales financing 31,246 29,391
Investment in marketable securities – 700 – 334
Proceeds from marketable securities 27 40
Cash outflow from investing activities [38]–11,231 – 9,715
Payment into equity 17 18
Payment of dividend for the previous year – 351 – 350
Proceeds from issue of bonds 5,669 3,721
Repayment of bonds – 3,483 – 2,924
Internal financing of financial operations – –
Change in debt 1,364 – 545
Change in commercial paper – 448 2,540
Cash inflow/outflow from financing activities [38]2,768 2,460
Effect of exchange rate and changes in composition of group
on cash and cash equivalents [38]–82 –99
Change in cash and cash equivalents – 674 – 104
Cash and cash equivalents as at 1 January 2,333 2,437
Cash and cash equivalents as at 31 December [38]1,659 2,333