BMW 2003 Annual Report Download - page 36
Download and view the complete annual report
Please find page 36 of the 2003 BMW annual report below. You can navigate through the pages in the report by either clicking on the pages listed below, or by using the keyword search tool below to find specific information within the annual report.-
 1
1 -
2
-
3
-
4
-
5
-
6
-
7
-
8
-
9
-
10
-
11
-
12
-
13
-
14
-
15
-
16
-
17
-
18
-
19
-
20
-
21
-
22
-
23
-
24
-
25
-
 26
26 -
 27
27 -
 28
28 -
 29
29 -
 30
30 -
 31
31 -
 32
32 -
 33
33 -
 34
34 -
 35
35 -
 36
36 -
 37
37 -
 38
38 -
 39
39 -
 40
40 -
 41
41 -
 42
42 -
 43
43 -
 44
44 -
 45
45 -
 46
46 -
47
-
48
-
49
-
50
-
51
-
52
-
53
-
54
-
55
-
56
-
57
-
58
-
59
-
60
-
61
-
62
-
63
-
64
-
65
-
66
-
67
-
68
-
69
-
70
-
71
-
72
-
73
-
74
-
75
-
76
-
77
-
78
-
79
-
80
-
81
-
82
-
83
-
84
-
85
-
86
-
87
-
88
-
89
-
90
-
91
-
92
-
93
-
94
-
95
-
96
-
97
-
98
-
99
-
100
-
101
-
102
-
103
-
104
-
105
-
106
-
107
-
108
-
109
-
110
-
111
-
112
-
113
-
114
-
115
-
116
-
117
-
118
-
119
-
120
-
121
-
122
-
123
-
124
-
125
-
126
-
127
-
128
-
129
-
130
-
131
-
132
-
133
-
134
-
135
-
136
-
137
-
138
-
139
-
140
-
141
-
142
-
143
-
144
-
145
-
146
-
147
-
148
-
149
-
150
-
151
-
152
-
153
-
154
-
155
-
156
-
157
-
158
-
159
-
160
-
161
-
162
-
163
-
164
-
165
-
166
-
167
-
168
-
169
-
170
-
171
-
172
-
173
-
174
-
175
-
176
-
177
-
178
-
179
-
180
-
181
-
182
-
183
-
184
-
185
-
186
-
187
-
188
-
189
-
190
-
191
-
192
-
193
-
194
-
195
-
196
-
197
-
198
-
199
-
200
-
201
-
202
-
203
-
204
-
205
-
206
-
207
 |
 |
35
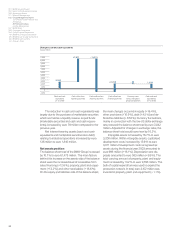
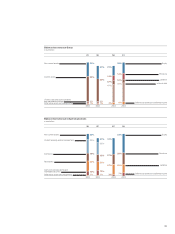
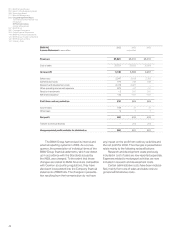
Balance sheet structure Group
in euro billion
61 56 56 61
33 %
66 %
1%
6%
2003
34 %
65 %
1%
6%
2002
25 %
14 %
57 %
47 %
4%
26 %
14 %
54 %
45 %
6%
2002 2003
Deferred tax assets and prepayments
of which cash and cash equivalents
and marketable securities
Current assets
Non-current assets
Deferred tax liabilities and deferred income
of which debt
Liabilities
Provisions
Equity
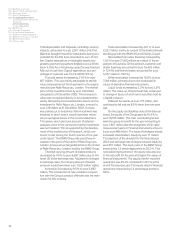
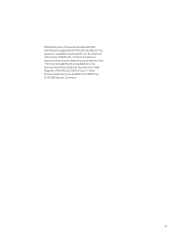
30 27 27 30
46 %
44 %
32 %
19 %
23 %
13 %
1%
33 %
19 %
24%
2003
Balance sheet structure Industrial operations
in euro billion
2002
45 %
43 %
27 %
27 %
3%
2002 2003
of which property, plant and equipment
Inventories
Receivables
10 %
Cash and cash equivalents and
marketable securities
1%
Deferred tax assets and prepayments
Non-current assets Equity
28 % Provisions
20 %
7%
Liabilities
Deferred tax liabilities and deferred income