BMW 2003 Annual Report Download - page 60
Download and view the complete annual report
Please find page 60 of the 2003 BMW annual report below. You can navigate through the pages in the report by either clicking on the pages listed below, or by using the keyword search tool below to find specific information within the annual report.-
 1
1 -
2
-
3
-
4
-
5
-
6
-
7
-
8
-
9
-
10
-
11
-
12
-
13
-
14
-
15
-
16
-
17
-
18
-
19
-
20
-
21
-
22
-
23
-
24
-
25
-
26
-
27
-
28
-
29
-
30
-
31
-
32
-
33
-
34
-
35
-
36
-
37
-
38
-
39
-
40
-
41
-
42
-
43
-
44
-
45
-
46
-
47
-
48
-
49
-
 50
50 -
 51
51 -
 52
52 -
 53
53 -
 54
54 -
 55
55 -
 56
56 -
 57
57 -
 58
58 -
 59
59 -
 60
60 -
 61
61 -
 62
62 -
 63
63 -
 64
64 -
 65
65 -
 66
66 -
 67
67 -
 68
68 -
 69
69 -
 70
70 -
71
-
72
-
73
-
74
-
75
-
76
-
77
-
78
-
79
-
80
-
81
-
82
-
83
-
84
-
85
-
86
-
87
-
88
-
89
-
90
-
91
-
92
-
93
-
94
-
95
-
96
-
97
-
98
-
99
-
100
-
101
-
102
-
103
-
104
-
105
-
106
-
107
-
108
-
109
-
110
-
111
-
112
-
113
-
114
-
115
-
116
-
117
-
118
-
119
-
120
-
121
-
122
-
123
-
124
-
125
-
126
-
127
-
128
-
129
-
130
-
131
-
132
-
133
-
134
-
135
-
136
-
137
-
138
-
139
-
140
-
141
-
142
-
143
-
144
-
145
-
146
-
147
-
148
-
149
-
150
-
151
-
152
-
153
-
154
-
155
-
156
-
157
-
158
-
159
-
160
-
161
-
162
-
163
-
164
-
165
-
166
-
167
-
168
-
169
-
170
-
171
-
172
-
173
-
174
-
175
-
176
-
177
-
178
-
179
-
180
-
181
-
182
-
183
-
184
-
185
-
186
-
187
-
188
-
189
-
190
-
191
-
192
-
193
-
194
-
195
-
196
-
197
-
198
-
199
-
200
-
201
-
202
-
203
-
204
-
205
-
206
-
207
 |
 |

59
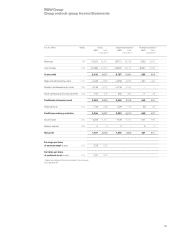
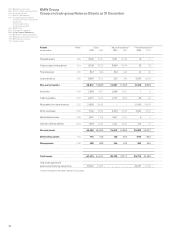
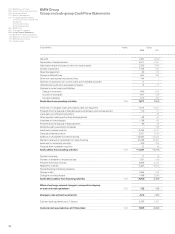
Industrial operations Financial operations
2003 2002 2003 2002
1,695 1,800 427 351 Net profit
672,146 1,784 Depreciation of leased products
2,369 2,129 21 20 Depreciation and amortisation of other non-current assets
1,157 890 –41 Increase in provisions
49 174 ––Rover disengagement
787 696 167 373 Change in deferred taxes
–59 46 –85 –45 Other non-cash income and expense items
–6 12–Gain/loss on disposal of non-current assets and marketable securities
13 –17 ––Undistributed results from associated companies
Changes in current assets and liabilities
– 651 – 808 11 –2 Change in inventories
–1,084 – 886 – 662 – 362 Increase in receivables
694 521 874 423 Increase in liabilities
4,970 4,553 2,901 2,583 Cash inflow from operating activities
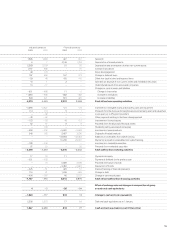
– 4,094 – 3,927 –21 –24 Investment in intangible assets and property, plant and equipment
114 110 51
Proceeds from the disposal of intangible assets and property, plant and equipment
––92 ––Loans paid out to Phoenix Consortium
–49 –82 ––Other payments relating to the Rover disengagement
–153 –50 –6 –12 Investment in financial assets
52 57 89Proceeds from the disposal of financial assets
–104 ––Dividends paid by associated companies
– 283 – 232 – 5,502 – 5,509 Investment in leased products
240 182 2,467 3,230 Disposals of leased products
––– 34,593 – 32,463 Additions to receivables from sales financing
––31,246 29,391 Payments received on receivables from sales financing
– 700 – 334 ––Investment in marketable securities
27 15 –25 Proceeds from marketable securities
– 4,846 – 4,249 – 6,396 – 5,352 Cash outflow from investing activities
17 18 11 –Payment into equity
– 351 – 350 ––Payment of dividend for the previous year
–73 5,669 3,648 Proceeds from issue of bonds
––– 3,483 – 2,924 Repayment of bonds
– 425 –51 425 51 Internal financing of financial operations
116 81 1,248 – 626 Change in debt
– 494 – 187 46 2,727 Change in commercial paper
–1,137 – 416 3,916 2,876 Cash inflow/outflow from financing activities
Effect of exchange rate and changes in composition of group
4–5 –86 –94 on cash and cash equivalents
–1,009 – 117 335 13 Change in cash and cash equivalents
2,256 2,373 77 64 Cash and cash equivalents as at 1 January
1,247 2,256 412 77 Cash and cash equivalents as at 31 December