BMW 2003 Annual Report Download - page 32
Download and view the complete annual report
Please find page 32 of the 2003 BMW annual report below. You can navigate through the pages in the report by either clicking on the pages listed below, or by using the keyword search tool below to find specific information within the annual report.-
 1
1 -
2
-
3
-
4
-
5
-
6
-
7
-
8
-
9
-
10
-
11
-
12
-
13
-
14
-
15
-
16
-
17
-
18
-
19
-
20
-
21
-
 22
22 -
 23
23 -
 24
24 -
 25
25 -
 26
26 -
 27
27 -
 28
28 -
 29
29 -
 30
30 -
 31
31 -
 32
32 -
 33
33 -
 34
34 -
 35
35 -
 36
36 -
 37
37 -
 38
38 -
 39
39 -
 40
40 -
 41
41 -
 42
42 -
43
-
44
-
45
-
46
-
47
-
48
-
49
-
50
-
51
-
52
-
53
-
54
-
55
-
56
-
57
-
58
-
59
-
60
-
61
-
62
-
63
-
64
-
65
-
66
-
67
-
68
-
69
-
70
-
71
-
72
-
73
-
74
-
75
-
76
-
77
-
78
-
79
-
80
-
81
-
82
-
83
-
84
-
85
-
86
-
87
-
88
-
89
-
90
-
91
-
92
-
93
-
94
-
95
-
96
-
97
-
98
-
99
-
100
-
101
-
102
-
103
-
104
-
105
-
106
-
107
-
108
-
109
-
110
-
111
-
112
-
113
-
114
-
115
-
116
-
117
-
118
-
119
-
120
-
121
-
122
-
123
-
124
-
125
-
126
-
127
-
128
-
129
-
130
-
131
-
132
-
133
-
134
-
135
-
136
-
137
-
138
-
139
-
140
-
141
-
142
-
143
-
144
-
145
-
146
-
147
-
148
-
149
-
150
-
151
-
152
-
153
-
154
-
155
-
156
-
157
-
158
-
159
-
160
-
161
-
162
-
163
-
164
-
165
-
166
-
167
-
168
-
169
-
170
-
171
-
172
-
173
-
174
-
175
-
176
-
177
-
178
-
179
-
180
-
181
-
182
-
183
-
184
-
185
-
186
-
187
-
188
-
189
-
190
-
191
-
192
-
193
-
194
-
195
-
196
-
197
-
198
-
199
-
200
-
201
-
202
-
203
-
204
-
205
-
206
-
207
 |
 |
31
reclassified figures. Further details regarding the
reasons for and the effects of the harmonisation of
the internal and external reporting systems are pro-
vided in Note [7]. Reconciliations are also provided
for each affected item in the income statement.
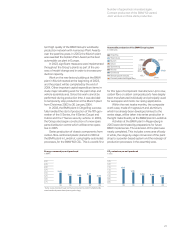
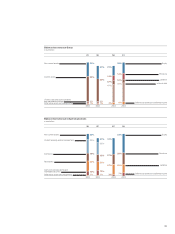
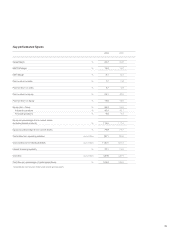
The BMW Group recorded a net profit of euro
1,947 million for the financial year 2003. The net
profit was therefore 3.6% below the figure for the
previous year. The pre-tax return on sales was 7.7%
(2002: 7.8%) and the post-tax return on sales was
4.7% (2002: 4.8%). The Group generated earnings
per share of common stock of euro 2.89 (2002:
euro 3.00) and earnings per share of preferred stock
of euro 2.91 (2002: euro 3.02).
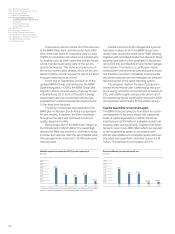
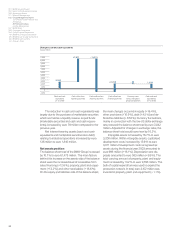
The low exchange rate of the US dollar im-
pacted the level of reported revenues for the year.
Group revenues fell by 2.1% compared to the pre-
vious year. However, adjusted for changes in ex-
change rates, the Group achieved revenue growth of
4.2%. Revenues from the sale of BMW, MINI and
Rolls-Royce brand cars were at the previous year’s
level despite the currency impact. Revenues from
motorcycle sales fell by 6.6% and revenues from
financial services fell by 9.8%, in both cases due to
currency fluctuations. Revenues generated by other
activities of the Group were 15.5% lower. This re-
duction was mainly attributable to the revenues of
the pressings plant in Swindon and of the Softlab
Group. Revenue increases were registered in almost
all regions. Revenues rose by 1.8% in Germany, by
1.7% for the remainder of Europe and by 12.1% for
the markets in Africa, Asia and Oceania. Revenues
generated in Asia climbed by 12.8%, mainly on the
back of exports to China. The lower US dollar ex-
change rate resulted in a 14.3% drop in revenues for
the Americas region compared to the previous year.
The USA remained, however, the strongest market
in revenue terms for the BMW Group.
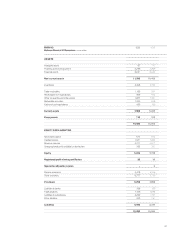
The reduction of cost of sales was 0.1 percent-
age points lower than that of revenues. The gross
profit fell by 2.3% and represented 22.7% (2002:
22.8%) of revenues. The gross profit percentage for
industrial operations fell by 0.6% and that of finan-
cial operations improved by 1.8%. Further details of
the entities consolidated in each of the sub-groups
are provided in Note [1].
Sales and administrative costs increased by only
1.3% despite the expansion of business volumes.
They represent 10.7% (2002: 10.4%) of revenues.
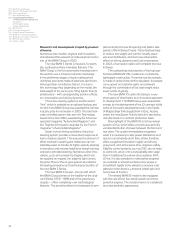
Research and development costs were at a simi-
larly high
level to the previous year.They represent
5.2% (2002: 5.0%) of revenues. Research and de-
velopment costs include depreciation and disposals
of euro 583 million (2002: euro 536 million) related
to development costs recognised as assets. Total
research and development costs, including research
costs and non-capitalised development
costs as
well as investment in capitalised development
costs,
amounted to euro 2,559 million (2002: euro 2,455
million). At this level, the research and development
ratio was 6.2% of revenues (2002: 5.8%).
Depreciation and amortisation included in cost
of sales, sales and administrative costs and research
and development costs amounted to euro 2,370
million (2002: euro 2,143 million).
The positive net amount of other operating in-
come and expenses increased by 37.8% compared
to the previous year. Whereas other operating in-
come was marginally higher than in the previous
year, other operating expenses fell by 15.0%. This
was attributable to the lower level of write-downs
and lower allocations to provisions.
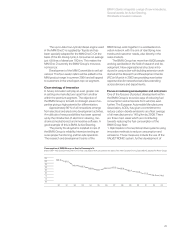
The net financial result improved by 28.8%
compared to the previous year. This was attributable
to gains arising on the fair market measurement of
derivative financial instruments. The financial result
All brands with new sales volume records.
Revenue down as a result of exchange rate changes.
Group profit from ordinary activities at previous
year’s level.
Capital expenditure increased again.
Cash flow again above previous year’s level.