BMW 2003 Annual Report Download - page 35
Download and view the complete annual report
Please find page 35 of the 2003 BMW annual report below. You can navigate through the pages in the report by either clicking on the pages listed below, or by using the keyword search tool below to find specific information within the annual report.-
 1
1 -
2
-
3
-
4
-
5
-
6
-
7
-
8
-
9
-
10
-
11
-
12
-
13
-
14
-
15
-
16
-
17
-
18
-
19
-
20
-
21
-
22
-
23
-
24
-
 25
25 -
 26
26 -
 27
27 -
 28
28 -
 29
29 -
 30
30 -
 31
31 -
 32
32 -
 33
33 -
 34
34 -
 35
35 -
 36
36 -
 37
37 -
 38
38 -
 39
39 -
 40
40 -
 41
41 -
 42
42 -
 43
43 -
 44
44 -
 45
45 -
46
-
47
-
48
-
49
-
50
-
51
-
52
-
53
-
54
-
55
-
56
-
57
-
58
-
59
-
60
-
61
-
62
-
63
-
64
-
65
-
66
-
67
-
68
-
69
-
70
-
71
-
72
-
73
-
74
-
75
-
76
-
77
-
78
-
79
-
80
-
81
-
82
-
83
-
84
-
85
-
86
-
87
-
88
-
89
-
90
-
91
-
92
-
93
-
94
-
95
-
96
-
97
-
98
-
99
-
100
-
101
-
102
-
103
-
104
-
105
-
106
-
107
-
108
-
109
-
110
-
111
-
112
-
113
-
114
-
115
-
116
-
117
-
118
-
119
-
120
-
121
-
122
-
123
-
124
-
125
-
126
-
127
-
128
-
129
-
130
-
131
-
132
-
133
-
134
-
135
-
136
-
137
-
138
-
139
-
140
-
141
-
142
-
143
-
144
-
145
-
146
-
147
-
148
-
149
-
150
-
151
-
152
-
153
-
154
-
155
-
156
-
157
-
158
-
159
-
160
-
161
-
162
-
163
-
164
-
165
-
166
-
167
-
168
-
169
-
170
-
171
-
172
-
173
-
174
-
175
-
176
-
177
-
178
-
179
-
180
-
181
-
182
-
183
-
184
-
185
-
186
-
187
-
188
-
189
-
190
-
191
-
192
-
193
-
194
-
195
-
196
-
197
-
198
-
199
-
200
-
201
-
202
-
203
-
204
-
205
-
206
-
207
 |
 |
001 BMW Group in figures
004 Report of the Supervisory Board
008 Supervisory Board
011 Board of Management
012 Group Management Report
12 A Review of the Financial Year
29 Outlook
30 Financial Analysis
44 Risk Management
047 BMW Stock
050 Corporate Governance
054 Group Financial Statements
118 BMW AG Principal Subsidiaries
120 BMW Group10-year Comparison
122 BMW Group Locations
124 Glossary, Index
34
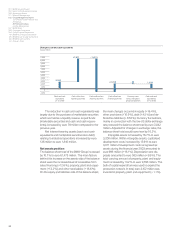
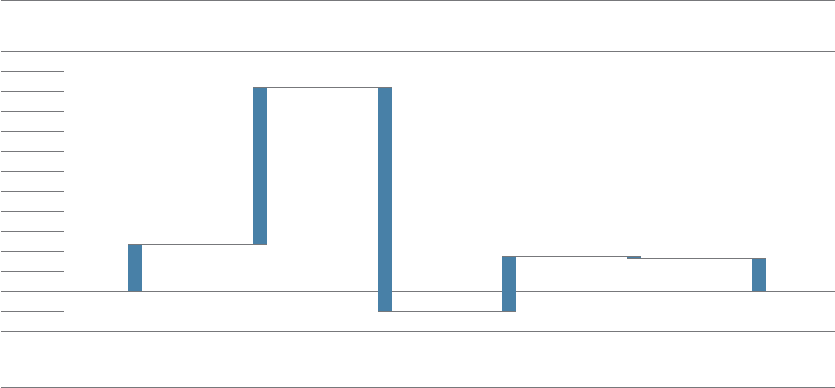
The reduction in cash and cash equivalents was
largely due to the purchase of marketable securities
which are held as a liquidity reserve. Liquid funds
(marketable securities and cash and cash equiva-
lents) increased by euro 78 million compared to the
previous year.
Net interest-bearing assets (cash and cash
equivalents and marketable securities less debt)
relating to industrial operations increased by euro
136 million to euro 1,816 million.
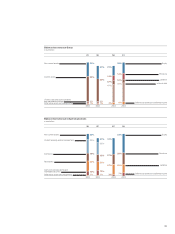
Net assets position
The balance sheet total of the BMW Group increased
by 10.7% to euro 61,475 million. The main factors
behind this increase on the assets side of the balance
sheet were the increased level of receivables from
sales financing (+12.6%), property, plant and equip-
ment (+13.2%) and other receivables (+ 18.6%).
On the equity and liabilities side of the balance sheet,
the main changes occurred in equity (+16.4%),
other provisions (+16.9%), debt (+4.5%) and de-
ferred tax liabilities (+67.6%). Currency fluctuations,
mainly in connection with the low
US
dollar exchange
rate, reduced the balance sheet total by euro 3,042
million. Adjusted for changes in exchange rates, the
balance sheet total would have risen by 16.2%.
Intangible assets increased by 16.7% to euro
3,200 million. Within intangible assets, capitalised
development costs increased by 15.9% to euro
3,011 million. Development costs recognised as
assets during the financial year 2003 amounted to
euro 996 million (+16.1%). Depreciation and dis-
posals amounted to euro 583 million (+8.8%). The
total carrying amount of property, plant and equip-
ment increased by 13.2% to euro 9,708 million.The
bulk of capital expenditure was used to expand the
production network. In total, euro 3,152 million was
invested in property, plant and equipment (+1.1%).
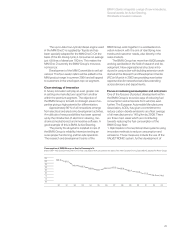
Change in cash and cash equivalents
in euro million
11,000
10,000
9,000
8,000
7,000
6,000
5,000
4,000
3,000
2,000
1,000
0
–1,000
Cash and cash
equivalents
31.12. 2002
Cash inflow from
operating activities
Cash outflow from
investing activities
Cash inflow from
financing activities
Currency trans-
lation, changes in
group composition
Cash and cash
equivalents
31.12. 2003
2,333
+7,871 –11,231
+ 2,768 –82 1,659