Avon 2004 Annual Report Download - page 56
Download and view the complete annual report
Please find page 56 of the 2004 Avon annual report below. You can navigate through the pages in the report by either clicking on the pages listed below, or by using the keyword search tool below to find specific information within the annual report.-
 1
1 -
2
-
3
-
4
-
5
-
6
-
7
-
8
-
9
-
10
-
11
-
12
-
13
-
14
-
15
-
16
-
17
-
18
-
19
-
20
-
21
-
22
-
23
-
24
-
25
-
26
-
27
-
28
-
29
-
30
-
31
-
32
-
33
-
34
-
35
-
36
-
37
-
38
-
39
-
40
-
41
-
42
-
43
-
44
-
45
-
 46
46 -
 47
47 -
 48
48 -
 49
49 -
 50
50 -
 51
51 -
 52
52 -
 53
53 -
 54
54 -
 55
55 -
 56
56 -
 57
57 -
 58
58 -
 59
59 -
 60
60 -
 61
61 -
 62
62 -
 63
63 -
 64
64 -
 65
65 -
 66
66 -
67
-
68
-
69
-
70
-
71
-
72
-
73
-
74
 |
 |

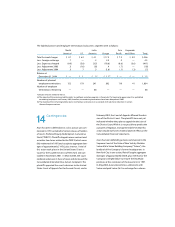
Global Beauty 77
Notes to Consolidated
Financial Statements
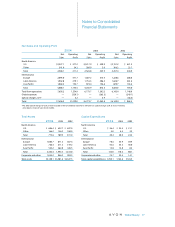
Net Sales and Operating Profit
2004 2003 2002
Net Operating Net Operating Net Operating
Sales Profit Sales Profit Sales Profit
North America
U.S. $2,227.1 $ 377.2 $2,217.9 $ 420.9 $2,151.2 $ 421.2
Other 341.0 34.2 308.9 5.0 306.2 23.7
Total 2,568.1 411.4 2,526.8 425.9 2,457.4 444.9
International
Europe 2,095.0 471.7 1,607.2 313.4 1,228.6 208.8
Latin America 1,932.8 479.1 1,716.3 406.3 1,626.7 361.6
Asia Pacific 1,060.3 192.7 923.4 156.6 829.7 133.6
Total 5,088.1 1,143.5 4,246.9 876.3 3,685.0 704.0
Total from operations 7,656.2 1,554.9 6,773.7 1,302.2 6,142.4 1,148.9
Global expenses — (329.1) — (263.3) — (249.1)
Special charges, net* — 3.2 — 3.9 — (36.3)
Total $7,656.2 $1,229.0 $6,773.7 $1,042.8 $6,142.4 $ 863.5
*The 2002 special charges of ($36.3) were included in the Consolidated Statements of Income as special charges ($34.3) and as inventory
write-downs in cost of sales ($2.0) in 2002.
Total Assets
2004 2003 2002
North America
U.S. $ 606.4 $ 633.7 $ 627.0
Other 166.2 156.2 184.0
Total 772.6 789.9 811.0
International
Europe 1,083.7 871.2 667.3
Latin America 726.4 611.5 519.2
Asia Pacific 522.2 462.8 426.5
Total 2,332.3 1,945.5 1,613.0
Corporate and other 1,043.2 846.2 903.5
Total assets $4,148.1 $3,581.6 $3,327.5
Capital Expenditures
2004 2003 2002
North America
U.S. $ 36.4 $ 25.5 $ 21.1
Other 4.0 4.5 3.2
Total 40.4 30.0 24.3
International
Europe 78.6 43.9 39.9
Latin America 42.6 53.5 40.0
Asia Pacific 13.8 12.8 8.2
Total 135.0 110.2 88.1
Corporate and other 74.7 22.4 14.1
Total capital expenditures $250.1 $162.6 $126.5