Avon 2004 Annual Report Download - page 15
Download and view the complete annual report
Please find page 15 of the 2004 Avon annual report below. You can navigate through the pages in the report by either clicking on the pages listed below, or by using the keyword search tool below to find specific information within the annual report.-
 1
1 -
2
-
3
-
4
-
 5
5 -
 6
6 -
 7
7 -
 8
8 -
 9
9 -
 10
10 -
 11
11 -
 12
12 -
 13
13 -
 14
14 -
 15
15 -
 16
16 -
 17
17 -
 18
18 -
 19
19 -
 20
20 -
 21
21 -
 22
22 -
 23
23 -
 24
24 -
 25
25 -
26
-
27
-
28
-
29
-
30
-
31
-
32
-
33
-
34
-
35
-
36
-
37
-
38
-
39
-
40
-
41
-
42
-
43
-
44
-
45
-
46
-
47
-
48
-
49
-
50
-
51
-
52
-
53
-
54
-
55
-
56
-
57
-
58
-
59
-
60
-
61
-
62
-
63
-
64
-
65
-
66
-
67
-
68
-
69
-
70
-
71
-
72
-
73
-
74
 |
 |

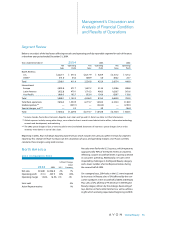
The decrease in operating margin in North America was
most significantly impacted by the following:
• Operating margin in the U.S. declined (which decreased
segment margin by 1.8 points) mainly due to a decline
in gross margin resulting from the following:
• inventory clearance programs in the first quar-
ter of 2004,
• repositioning costs related to Beyond Beauty,
specifically inventory write-offs for toys, and
• higher costs for fuel, warehousing and storage.
The declines were partially offset by higher Repre-
sentative fees and a favorable mix of products
sold. Additionally, operating margin was negatively
impacted by an unfavorable expense ratio, result-
ing from higher pension, bad debt and shipping
expenses.
• Operating margin in the U.S. Retail business in 2003
included costs of $18.3 associated with the reposition-
ing of the beComing line of products (which caused
segment margin to be favorable in 2004 by .8 point).
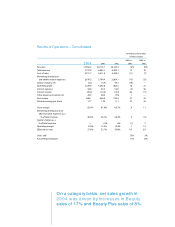
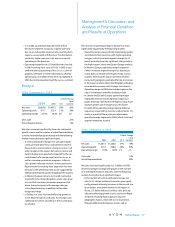
2003 Compared to 2002
%/Point Change
Local
2003 2002 US $ Currency
Net sales $2,526.8 $2,457.4 3% 3%
Operating profit 425.9 444.9 (4)% (4)%
Operating margin 16.5% 17.8% (1.3) (1.3)
Units sold 2%
Active Representatives 3%
The U.S. business reported a sales increase of 3% in 2003
resulting from a higher number of active Representatives
(reflecting growth of the Sales Leadership program),
increases in units, and successful new product launches
including mark.
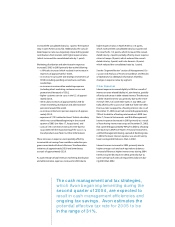
On a category basis, the 2003 sales increase in the U.S.
was driven by a 9% increase in Beauty sales (reflecting
strong increases in the skin care and personal care cate-
gories, partially offset by a decline in fragrance). That
increase was largely offset by a 4% decline in Beyond
Beauty sales and a 1% decline in Beauty Plus sales,
reflecting a strategic de-emphasis of toys, severe snow-
storms and the impact of the war in Iraq on consumer
spending in the first half of 2003, as well as a temporary
inability to fill demand for certain holiday non-beauty
products in the fourth quarter of 2003.
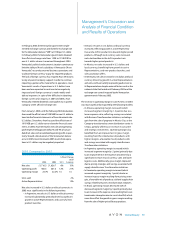
The decrease in operating margin in North America in 2003
was most significantly impacted by the following markets:
• In the U.S., operating margin declined (which
decreased segment margin by .6 point) primarily due
to an unfavorable expense ratio. The unfavorable
expense ratio was driven by incremental consumer
and strategic spending in support of mark. as well as
increased advertising. In addition, higher customer
service expenses and higher pension-related costs
were partially offset by lower bonus accruals and
a higher customer order charge. The unfavorable
expense ratio was partially offset by an improvement
in gross margin mainly due to a favorable mix of prod-
ucts sold and savings resulting from supply chain Busi-
ness Transformation initiatives.
• In the Dominican Republic, operating margin declined
(which decreased segment margin by .4 point) as a
result of a sales decline.
Europe’s net sales increased significantly to
surpass $2.0 billion for the first time, driven by
substantial growth in units and the number of
active Representatives, as well as favorable
foreign exchange.