Avon 2004 Annual Report Download - page 21
Download and view the complete annual report
Please find page 21 of the 2004 Avon annual report below. You can navigate through the pages in the report by either clicking on the pages listed below, or by using the keyword search tool below to find specific information within the annual report.-
 1
1 -
2
-
3
-
4
-
5
-
6
-
7
-
8
-
9
-
10
-
 11
11 -
 12
12 -
 13
13 -
 14
14 -
 15
15 -
 16
16 -
 17
17 -
 18
18 -
 19
19 -
 20
20 -
 21
21 -
 22
22 -
 23
23 -
 24
24 -
 25
25 -
 26
26 -
 27
27 -
 28
28 -
 29
29 -
 30
30 -
 31
31 -
32
-
33
-
34
-
35
-
36
-
37
-
38
-
39
-
40
-
41
-
42
-
43
-
44
-
45
-
46
-
47
-
48
-
49
-
50
-
51
-
52
-
53
-
54
-
55
-
56
-
57
-
58
-
59
-
60
-
61
-
62
-
63
-
64
-
65
-
66
-
67
-
68
-
69
-
70
-
71
-
72
-
73
-
74
 |
 |

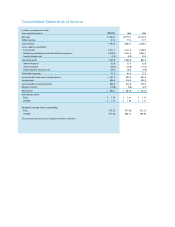
Net cash provided by operating activities
reached a record level of $882.6 in 2004,
$137.3 favorable to 2003.
Liquidity and Capital Resources
Avon’s principal sources of funds historically have been
cash flows from operations, commercial paper and bor-
rowings under lines of credit. Management believes that
cash from operations and available sources of financing
are adequate to meet anticipated requirements for
working capital, dividends, capital expenditures, the
stock repurchase program and other cash needs.
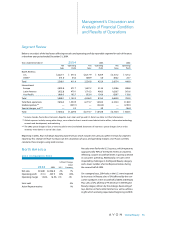
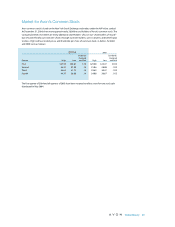
Balance Sheet Data 2004 2003
Cash and cash equivalents $ 769.6 $ 694.0
Total debt 918.0 1,121.8
Working capital 980.9 619.1
Cash Flows2004 2003 2002
Net cash provided by
operating activities $ 882.6 $ 745.3 $ 565.4
Net cash used by
investing activities (279.4) (178.4) (123.0)
Net cash used by financing
activities (567.0) (495.5) (331.8)
Effect of exchange rate
changes on cash
and equivalents 39.4 15.8 (12.3)
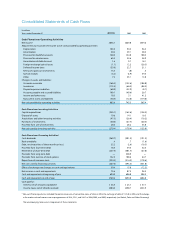
Net Cash Provided by Operating Activities
Net cash provided by operating activities in 2004 was $137.3
favorable to 2003 principally reflecting the following:
• Higher net income (adjusted for non-cash items), and
• Favorable working capital levels in accounts payable
and accrued expenses, including lower cash outlays in
2004 for bonus and restructuring payments, as well as a
higher number of accounts payable days outstanding.
These sources of cash were partially offset by the following:
• Unfavorable working capital levels in accounts
receivable and inventories, primarily reflecting
higher sales in 2004, as well as an increase in inven-
tory days outstanding (increase of 1 day in 2004 ver-
sus 2003 as compared to a decrease of 7 days in 2003
versus 2002),
• Higher contributions to the U.S. qualified pension
plan ($90.0 in 2004 versus $60.0 in 2003), and
• Higher tax audit settlement payments ($71.2 in 2004
versus $45.1 in 2003).
Avon maintains qualified defined benefit pension plans
and unfunded supplemental pension benefit plans (see
Note 10, Employee Benefit Plans). Avon’s funding policy for
these plans is based on legal requirements and cash flows.
The amounts necessary to fund future obligations under
these plans could vary depending on estimated assump-
tions (as detailed in “Critical Accounting Estimates”). The
future funding for these plans will depend on economic
conditions, employee demographics, mortality rates, the
number of associates electing to take lump-sum distribu-
tions, investment performance and funding decisions.
Based on current assumptions, Avon expects to contribute
approximately $85.0 and $37.0, respectively, to its U.S. and
international pension plans in 2005.
Inventories of $740.5 at December 31, 2004 were higher
than $653.4 at December 31, 2003. It is Avon’s objective to
continue to focus on inventory management. However,
the addition or expansion of product lines, which are sub-
ject to changing fashion trends and consumer tastes, as
well as planned expansion in high growth markets, may
cause inventory levels to grow periodically.
Net Cash Used by Investing Activities
Net cash used by investing activities in 2004 was $101.0
higher than in 2003 resulting from the following:
• Higher capital expenditures and
• The purchase in 2004 of additional shares in its two
subsidiaries in China for $45.6 as compared to the
purchase in 2003 of the outstanding shares in Avon’s
Turkish business for $18.4 (see Note 17, Acquisitions).
Capital expenditures during 2004 were $250.1 compared
with $162.6 in 2003. The increase in capital spending was
primarily driven by continued investments for capacity
expansion (primarily a new manufacturing facility in
Russia), facility modernization (primarily the construction
of a new research and development facility in the U.S.),
and improvements to existing facilities, information sys-
tems and equipment replacement projects. Numerous
construction and information systems projects were in
progress at December 31, 2004, with an estimated cost to
complete of approximately $135.0. Capital expenditures
in 2005 are currently expected to be approximately
$280.0 and will be funded by cash from operations. These
expenditures will include continued investments for
capacity expansion, facility modernization (primarily the
continuation of construction of the new research and
development facility in the U.S.), information systems
(including the development of the ERP project previously
discussed) and equipment replacement projects.