Avon 2004 Annual Report Download - page 14
Download and view the complete annual report
Please find page 14 of the 2004 Avon annual report below. You can navigate through the pages in the report by either clicking on the pages listed below, or by using the keyword search tool below to find specific information within the annual report.-
 1
1 -
2
-
3
-
 4
4 -
 5
5 -
 6
6 -
 7
7 -
 8
8 -
 9
9 -
 10
10 -
 11
11 -
 12
12 -
 13
13 -
 14
14 -
 15
15 -
 16
16 -
 17
17 -
 18
18 -
 19
19 -
 20
20 -
 21
21 -
 22
22 -
 23
23 -
 24
24 -
25
-
26
-
27
-
28
-
29
-
30
-
31
-
32
-
33
-
34
-
35
-
36
-
37
-
38
-
39
-
40
-
41
-
42
-
43
-
44
-
45
-
46
-
47
-
48
-
49
-
50
-
51
-
52
-
53
-
54
-
55
-
56
-
57
-
58
-
59
-
60
-
61
-
62
-
63
-
64
-
65
-
66
-
67
-
68
-
69
-
70
-
71
-
72
-
73
-
74
 |
 |

Management’s Discussion and
Analysis of Financial Condition
and Results of Operations
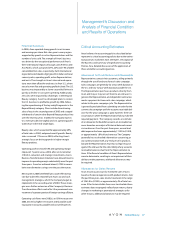
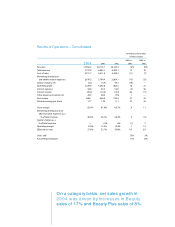
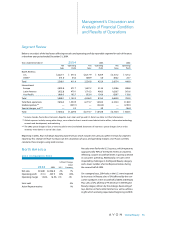
Segment Review
Below is an analysis of the key factors affecting net sales and operating profit by reportable segment for each of the years
in the three-year period ended December 31, 2004.
Years ended December 31 2004 2003 2002
Net Operating Net Operating Net Operating
Sales Profit Sales Profit Sales Profit
North America
U.S. $2,227.1 $ 377.2 $2,217.9 $ 420.9 $2,151.2 $ 421.2
Other* 341.0 34.2 308.9 5.0 306.2 23.7
Total 2,568.1 411.4 2,526.8 425.9 2,457.4 444.9
International
Europe 2,095.0 471.7 1,607.2 313.4 1,228.6 208.8
Latin America 1,932.8 479.1 1,716.3 406.3 1,626.7 361.6
Asia Pacific 1,060.3 192.7 923.4 156.6 829.7 133.6
Total 5,088.1 1,143.5 4,246.9 876.3 3,685.0 704.0
Total from operations 7,656.2 1,554.9 6,773.7 1,302.2 6,142.4 1,148.9
Global expenses** — (329.1) — (263.3) — (249.1)
Special charges, net*** — 3.2 — 3.9 — (36.3)
Total $7,656.2 $1,229.0 $6,773.7 $1,042.8 $6,142.4 $ 863.5
* Includes Canada, Puerto Rico, Dominican Republic, Avon Salon and Spa and U.S. Retail (see Note 16, Other Information).
** Global expenses include, among other things, costs related to Avon’s executive and administrative offices, information technology,
research and development, and marketing.
*** The 2002 special charges of ($36.3) were included in the Consolidated Statements of Income as special charges ($34.3) and as
inventory write-downs in cost of sales ($2.0).
Beginning in 2005, Avon will begin reporting total revenue, which includes net sales plus other revenue, for segment
reporting. This change will have no impact on the calculations of gross and operating margins since Avon currently
calculates these margins using total revenue.
Global Beauty 35
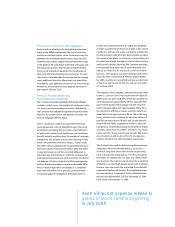
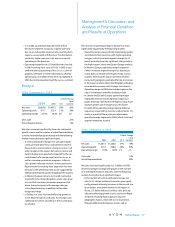
North America
2004 Compared to 2003
%/Point Change
Local
2004 2003 US $ Currency
Net sales $2,568.1 $2,526.8 2% 1%
Operating profit 411.4 425.9 (3)% (3)%
Operating margin 15.6% 16.5% (.9) (.9)
Units sold 3%
Active Representatives 1%
Net sales were flat for the U.S. business, which represents
approximately 90% of the North American segment,
reflecting a slower second half driven in part by a decline
in consumer spending. Additionally, net sales were
impacted by challenges in the Beyond Beauty category
and a lower number of active Representatives during
the second half of 2004.
On a category basis, 2004 sales in the U.S. were impacted
by increases in Beauty sales of 3% (affected by the con-
sumer slowdown in the second half of 2004) and Beauty
Plus sales of 2%, offset by a 9% decrease in the Beyond
Beauty category (driven by the strategic downsizing of
toys, declines in home entertainment, as well as softness
in gifts which are being repositioned beginning in 2005).