Avon 2004 Annual Report Download - page 16
Download and view the complete annual report
Please find page 16 of the 2004 Avon annual report below. You can navigate through the pages in the report by either clicking on the pages listed below, or by using the keyword search tool below to find specific information within the annual report.-
 1
1 -
2
-
3
-
4
-
5
-
 6
6 -
 7
7 -
 8
8 -
 9
9 -
 10
10 -
 11
11 -
 12
12 -
 13
13 -
 14
14 -
 15
15 -
 16
16 -
 17
17 -
 18
18 -
 19
19 -
 20
20 -
 21
21 -
 22
22 -
 23
23 -
 24
24 -
 25
25 -
 26
26 -
27
-
28
-
29
-
30
-
31
-
32
-
33
-
34
-
35
-
36
-
37
-
38
-
39
-
40
-
41
-
42
-
43
-
44
-
45
-
46
-
47
-
48
-
49
-
50
-
51
-
52
-
53
-
54
-
55
-
56
-
57
-
58
-
59
-
60
-
61
-
62
-
63
-
64
-
65
-
66
-
67
-
68
-
69
-
70
-
71
-
72
-
73
-
74
 |
 |

Management’s Discussion and
Analysis of Financial Condition
and Results of Operations
• In Canada, operating margin declined (which
decreased segment margin by .3 point) primarily
due to an unfavorable expense ratio resulting from
expenses associated with Business Transformation
initiatives, higher pension costs and incremental
spending on the brochure.
• Operating margin for the U.S. Retail business was flat
in 2003 resulting from costs of $18.3 in 2003 associ-
ated with the repositioning of the beComing line of
products (see Note 17, Other Information), offset by
operating losses in 2002, which were not repeated in
2003 due to the repositioning of the beComing brand.
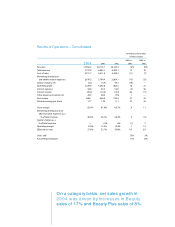
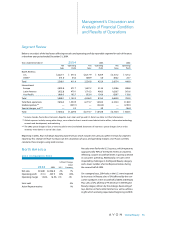
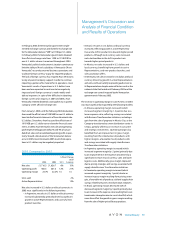
Europe
2004 Compared to 2003
%/Point Change
Local
2004 2003 US $ Currency
Net sales $2,095.0 $1,607.2 30% 20%
Operating profit 471.7 313.4 51% 39%
Operating margin 22.4% 19.4% 3.0 3.0
Units sold 22%
Active Representatives 16%
Net sales increased significantly driven by substantial
growth in units and the number of active Representatives,
as well as favorable foreign exchange, with the following
markets having the most significant impact:
• In Central and Eastern Europe, net sales grew signifi-
cantly, primarily driven by a substantial increase in
Russia and, to a lesser extent, strong increases in all
other markets in the region. Net sales in Central and
Eastern Europe were positively impacted by the suc-
cessful launch of a new personal care line, Senses, as
well as consumer promotion programs. In Russia,
sales growth reflected increases in units and active
Representatives resulting from expansion into new
territories, with penetration and access supported by
additional distribution points throughout the country.
• In Western Europe, net sales increased mainly due
to growth in the United Kingdom, where sales grew
as a result of consumer promotion programs that
drove strong increases in the average sales per
active Representative, in addition to favorable
foreign exchange.
• In Turkey, net sales increased reflecting growth in
active Representatives and units. Avon began con-
solidating its Turkish subsidiary in the second quar-
ter of 2003.
The increase in operating margin in Europe was most
significantly impacted by the following markets:
• Operating margin was positively impacted by greater
contributions from countries with higher operating
margins (which increased segment margin by .8
point), primarily driven by significant sales growth in
the high margin Central and Eastern Europe markets.
• In Western Europe, operating margin improved
(which increased segment margin by .8 point) pri-
marily due to a decline in the expense ratio in most
markets reflecting the impact of field and other
restructuring programs, partially offset by an increase
in the expense ratio in the United Kingdom reflecting
incremental consumer and strategic investments.
Operating margin in 2004 also includes a gain on the
sale of a warehouse and office building in Italy.
• In Central and Eastern Europe, operating margin
improved (which increased segment margin by .6
point), driven by a decrease in the expense ratio result-
ing from greater sales leverage across the cluster.
• In South Africa, operating margin during 2003 was
negatively impacted by inventory adjustments. Pri-
marily as a result of these prior year adjustments,
operating margin improved in 2004 (which increased
segment margin by .4 point).
2003 Compared to 2002
%/Point Change
Local
2003 2002 US $ Currency
Net sales $1,607.2 $1,228.6 31% 19%
Operating profit 313.4 208.8 50% 40%
Operating margin 19.4% 16.9% 2.5 2.5
Units sold 14%
Active Representatives 20%
Net sales increased significantly in U.S. dollars in 2003
driven by foreign exchange and growth in the number
of active Representatives and units, with the following
markets having the most significant impact:
• In the markets of Central and Eastern Europe, net
sales in U.S. dollars and local currencies grew signifi-
cantly primarily driven by increases in Russia and, to a
lesser extent, most other markets in the region. In
Russia, U.S. dollar and local currency sales grew sig-
nificantly reflecting growth in units and active Repre-
sentatives resulting from expansion into new
geographic regions, improved access to products
through additional distribution centers and an
Global Beauty 37