Avon 2004 Annual Report Download - page 20
Download and view the complete annual report
Please find page 20 of the 2004 Avon annual report below. You can navigate through the pages in the report by either clicking on the pages listed below, or by using the keyword search tool below to find specific information within the annual report.-
 1
1 -
2
-
3
-
4
-
5
-
6
-
7
-
8
-
9
-
 10
10 -
 11
11 -
 12
12 -
 13
13 -
 14
14 -
 15
15 -
 16
16 -
 17
17 -
 18
18 -
 19
19 -
 20
20 -
 21
21 -
 22
22 -
 23
23 -
 24
24 -
 25
25 -
 26
26 -
 27
27 -
 28
28 -
 29
29 -
 30
30 -
31
-
32
-
33
-
34
-
35
-
36
-
37
-
38
-
39
-
40
-
41
-
42
-
43
-
44
-
45
-
46
-
47
-
48
-
49
-
50
-
51
-
52
-
53
-
54
-
55
-
56
-
57
-
58
-
59
-
60
-
61
-
62
-
63
-
64
-
65
-
66
-
67
-
68
-
69
-
70
-
71
-
72
-
73
-
74
 |
 |

Management’s Discussion and
Analysis of Financial Condition
and Results of Operations
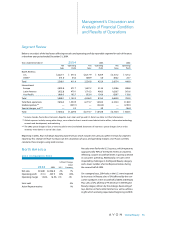
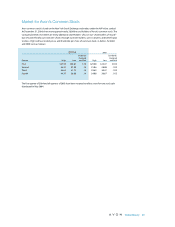
2003 Compared to 2002
%/Point Change
Local
2003 2002 US $ Currency
Net sales $ 923.4 $ 829.7 11% 7%
Operating profit 156.6 133.6 17% 13%
Operating margin 16.7% 15.8% 0.9 0.9
Units sold 2%
Active Representatives 11%
Net sales in U.S. dollars and local currencies increased in
2003 as a result of growth in most major markets in the
region, reflecting increases in active Representatives.
Major markets in the region experienced healthy growth
in units, partially offset by declines in certain Southeast
Asia markets.
• In China, net sales in U.S. dollars and local currency
increased primarily due to consumer motivation pro-
grams, in spite of the negative impact from the out-
break of severe acute respiratory syndrome (“SARS”)
during the second quarter of 2003.
• In Japan, net sales in U.S dollars increased significantly
mainly due to favorable foreign exchange and growth
in active Representatives driven largely by an increase
in the number of direct mailings to customers.
• In Australia, increases in net sales in U.S. dollars were
driven by foreign exchange and growth in active
Representatives.
• In the Philippines, net sales in U.S. dollars were nega-
tively impacted by foreign exchange. Net sales in
local currency increased slightly, driven by an
increase in active Representatives and units.
The outbreak of SARS in Asia had a significant impact
on China and Taiwan in the second quarter of 2003.
The Company estimates that it reduced full year 2003
net sales and unit growth in the region each by two
percentage points. The Company experienced no sig-
nificant SARS-related impact on its business in the
third or fourth quarter of 2003.
The increase in operating margin in Asia Pacific in 2003
was most significantly impacted by the following markets:
• In Japan, operating margin increased (which increased
segment margin by .6 point) primarily due to a higher
gross margin resulting from savings associated with
supply chain Business Transformation initiatives.
• In the Philippines, operating margin improved
(which increased segment margin by .6 point) due to
a higher gross margin resulting from savings associ-
ated with supply chain Business Transformation ini-
tiatives, and increased sales of Beauty products,
which have a higher margin.
• In China, operating margin improved (which increased
segment margin by .3 point) primarily due to an improve-
ment in gross margin, reflecting supply chain savings
associated with Business Transformation initiatives and
the benefits from significant volume growth.
• In Australia, operating margin improved (which
increased segment margin by .4 point) primarily due
to an improvement in gross margin driven by a
strong local currency.
• In the markets of Southeast Asia, operating margin
declined (which reduced segment margin by .6
point) principally due to expenses associated with
the reorganization of sales branches in Malaysia, and
sales declines in Thailand and Indonesia.
Global Expenses
Global expenses increased $65.8 in 2004 primarily due
to higher bonus and benefit-related accruals of approxi-
mately $25.0, higher professional fees and expenses of
$22.4 (including $6.2 related to the settlement of one
Solow lawsuit, see Note 14, Contingencies) and incre-
mental investments of $15.4 for research and develop-
ment, and marketing.
Global expenses increased $14.2 in 2003 primarily
due to incremental investments related to Avon’s sup-
ply chain initiatives and research and development,
and marketing.
Global Beauty 41